CentOS Linux release 8.2 Grafana v11.1.0
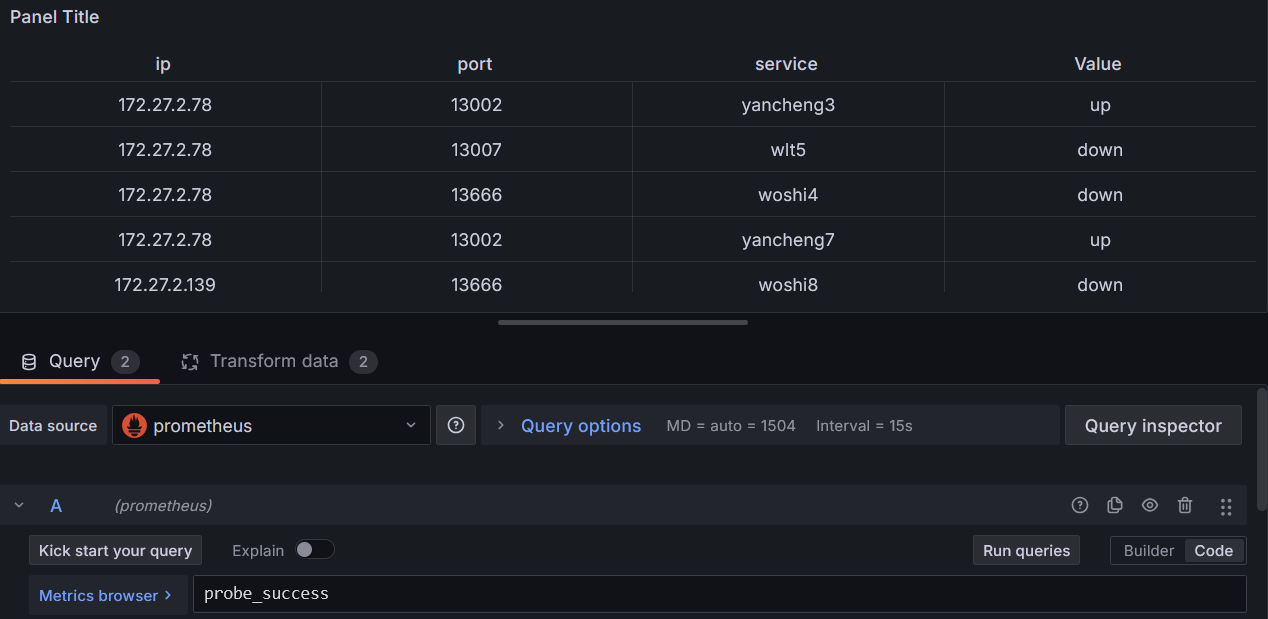
I am using blackbox_exporter for server port monitoring, and the attached data is displayed. I now want to implement the same host as one row and multiple ports as columns. May I ask what methods are available to achieve this
For example: IP Port Service Name Port Status Port Service Name Port Status
can you share that attached data?
Sorry, I will upload again. The 3345 image is the goal I want to achieve or recommend a better way to display it
as close as i could get it:

I had some mistakes in my previous ideas, which were unrealistic. Now I have changed my mind. Using ports as rows and IP as columns, as shown in the image, 1 represents their values. How to implement it, please
After continuous efforts, the expected results have been achieved. Thank you for your reply
The following link is the operation document I wrote
https://zhuanlan.zhihu.com/p/711949870