Hello
I try to animate an svg with ACE.SVG on grafana, for now just change the color attribut dynamically according to her state, but I can’t get the svg animation to work, if anyone has experiences on this.
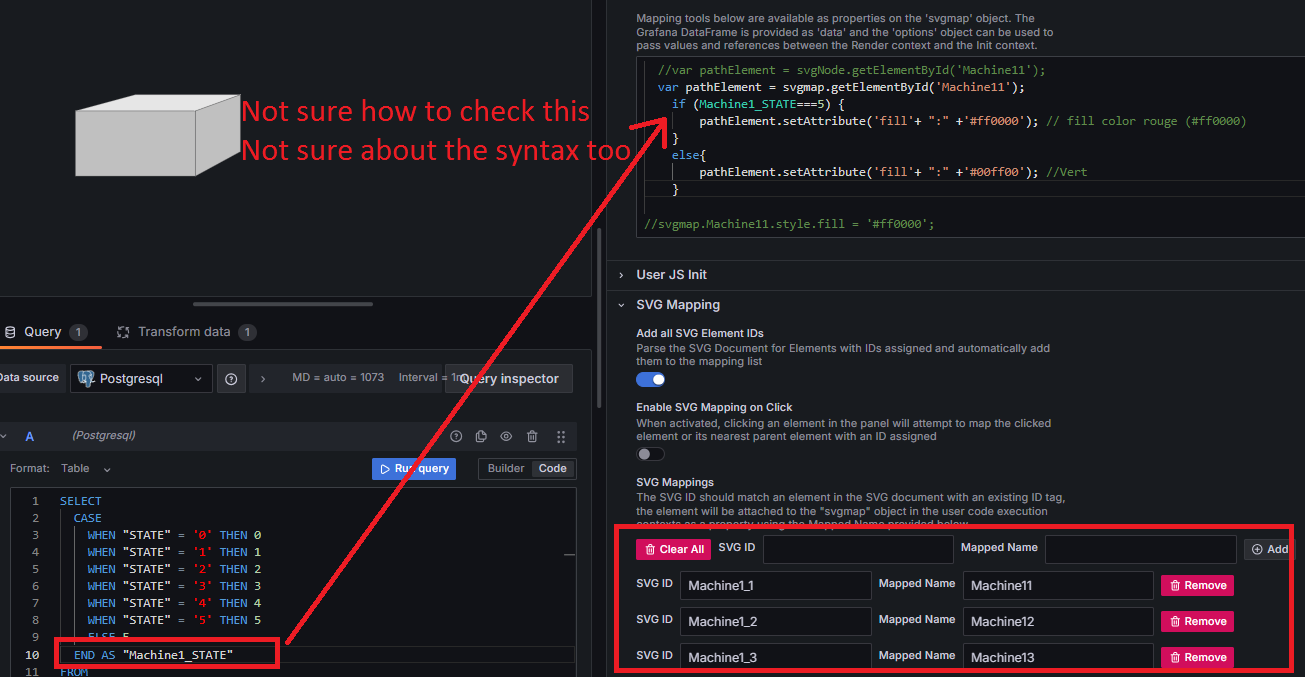
With my sql query I have the state of my machine set at 5 to try to get the color red but I don’t know how to get further diagnostics, my rectangle stay grey.
Simple example for default SVG provided by plugin and letterA mapped to path4548:
let stroke = data.series[0].fields[0].values[data.series[0].fields[0].values.length-1];
let fill = data.series[0].fields[1].values[data.series[0].fields[1].values.length-1];
let strokecolor = stroke < 100 ? 'red' : 'blue';
let fillcolor = fill < 50 ? 'green' : 'yellow';
svgmap.letterA.attr('style',`stroke:${strokecolor};fill:${fillcolor};stroke-width: 5px`)