dsp76
May 7, 2024, 3:01pm
1
I read the documentation State timeline | Grafana documentation and saw, that for each series there is a column. For testing I used a .csv file.
I wonder if I could also use a vacation table of employees to show up.
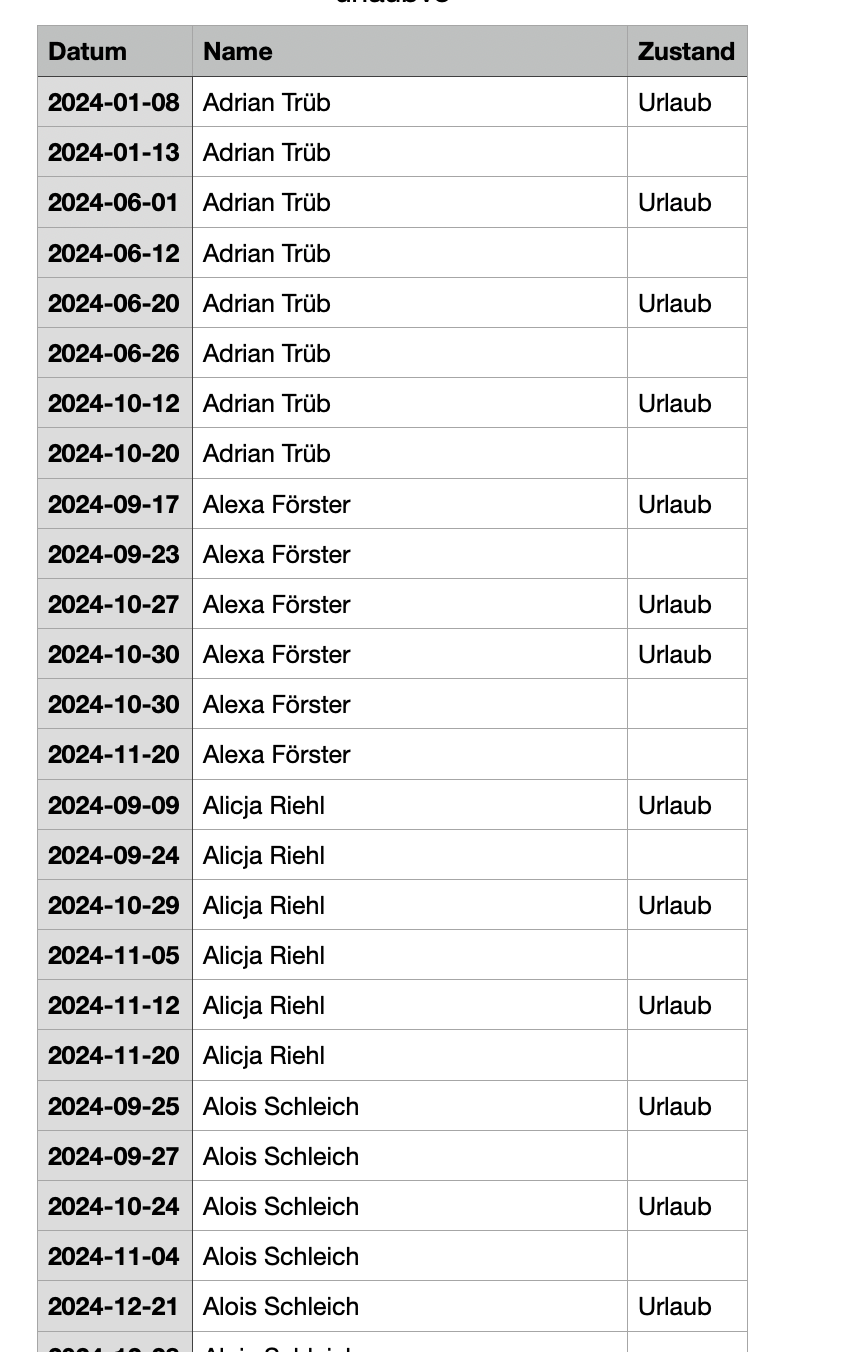
Initially I used a table like this - no worries - all fake data:
I understood it should be a timeline - so I used this, where timestamps mark state changes:
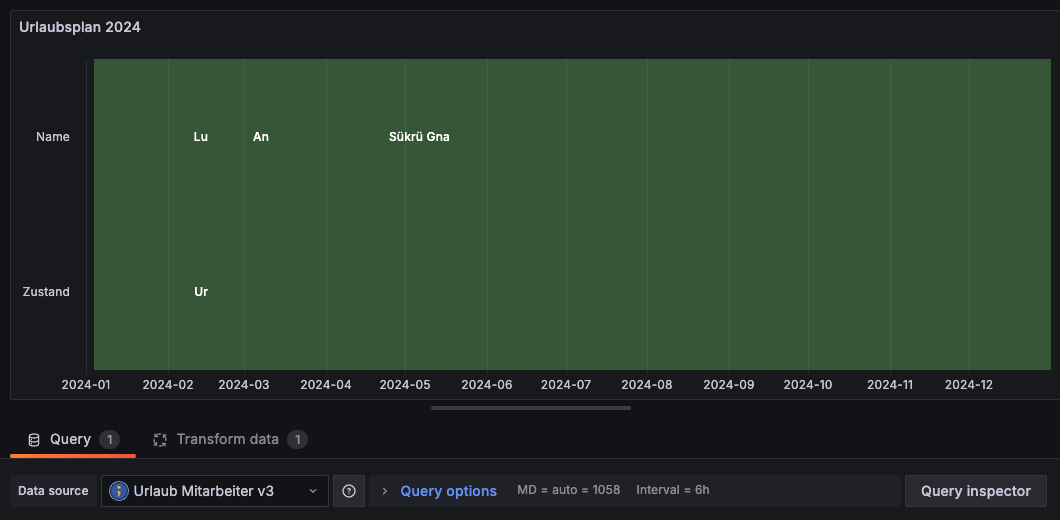
However - still I have the problem to split up into a new line for each name change.
The result still looks like this:
Do I really need to split into columns for each employee? Or is there a transformation to do this within Grafana?
Thanks for your insights!
I think it might require a numeric value? and the column names have to be metric value and time?
mock data
time	value	metric
2024-05-07 15:38:19.610	50.2	Adrian Trub
2024-05-07 15:39:19.610	NULL	Adrian Trub
2024-05-07 15:39:19.610	100.0	Adrian Trub
2024-05-07 15:40:19.610	200.0	Darth Vader
or use the Business Calendar plugin
1 Like
dsp76
May 7, 2024, 8:46pm
3
Hi there, thanks for this idea. I also worked on it.
Now my panel looks like this:
I just need to make sure, the empty fields get another color than the “Urlaub” fields
1 Like
dsp76
May 7, 2024, 8:57pm
4
You are right with
I think it might require a numeric value?
Because I need thresholds for coloring the days… Did you set the colors by thresholds in your example?
I can’t find the Business Calendar plugin. Does it also give a year view with days, but without time?