Hello,
I am new to Grafana.
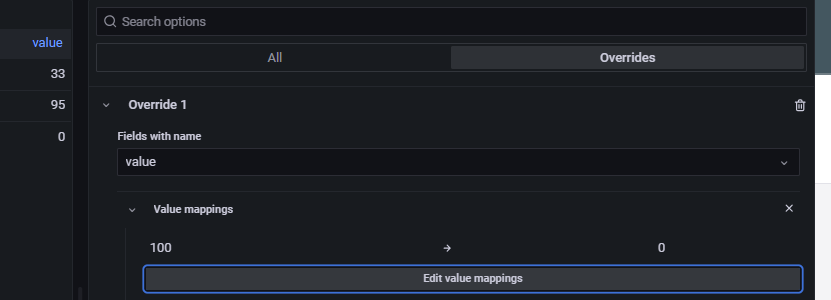
I made a Stat-Panel. I added a Value Mapping: (Range 0 to 100 → 0). I want all values under 100 to be shown as 0.
This works for the numbrer value, but NOT for the graph.

THe value has been <100 (so should be 0) the whole time, however the graph shows the non-value mapped value.
How do I also set the value mapping for the graph?
Thank you
Daniel