Hi everyone,
I just came across this thread because I was looking for a solution to exactly this problem. As there obviously is no progress on the feature request (which is a real shame) I’ve been pondering over a workaround on basis of the bar chart since the solution with the time series has some nasty drawbacks (e.g. with showing the data when hovering over the data points).
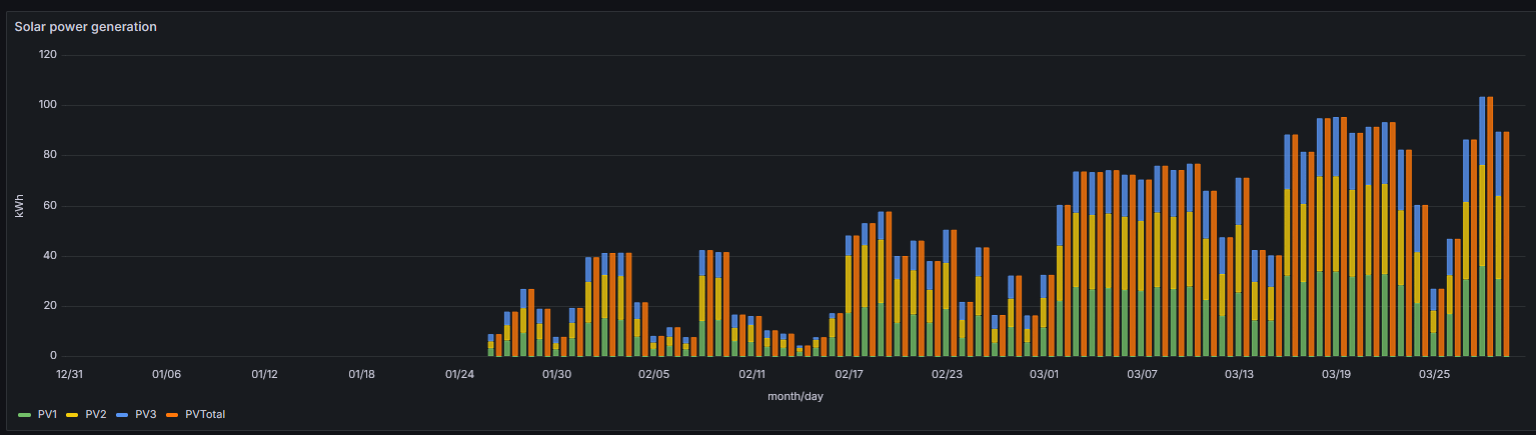
I actually came to this solution:
Aggregate the data series you do not want to be stacked on slightly different time points. So, in my case I have several data series with daily data points each timestamped on 1 a.m.. One of these series contains the sum of all the other series per day and therefore should not be stacked in the bar chart. By shifting all data points of the sum series by 1h to 2 p.m. forces Grafana to show this data series in a separate bar. See this screenshot:
Maybe this workaround is working for you, too … as long as Grafana is not have the capabilties.