Environment:
Grafana - 7.5.4
ElasticSearch - Master pulled last week
Grouped Bar Chart - 1.0.3
client- Windows 10
I am trying to chart a set of exceptions we get every day so we can see trends. I have written an automated java uploader to push the data into elastic search and have 20K records covering some months.
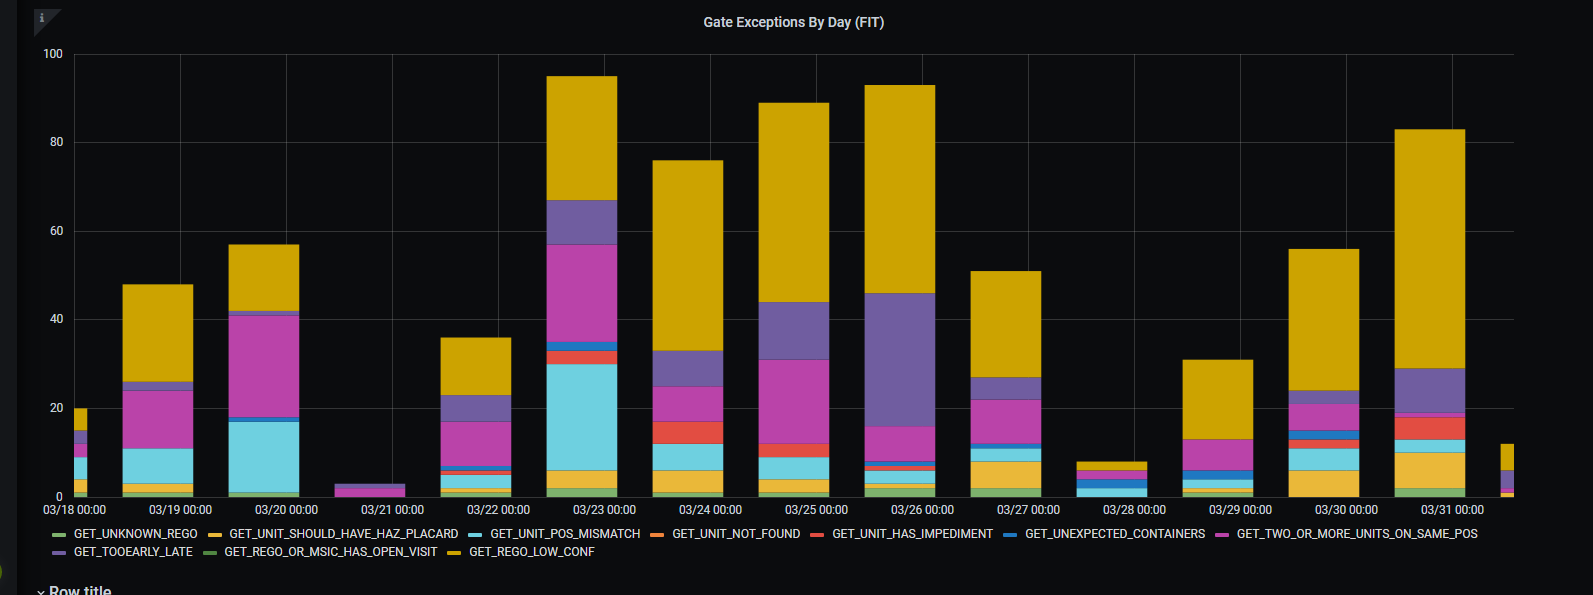
The sensible visualization for this data is a stacked bar chart so -
- we can see number of exceptions a day
- the number of each type within a day
- and do side by side comparison of how we are tracking between days all at the same time
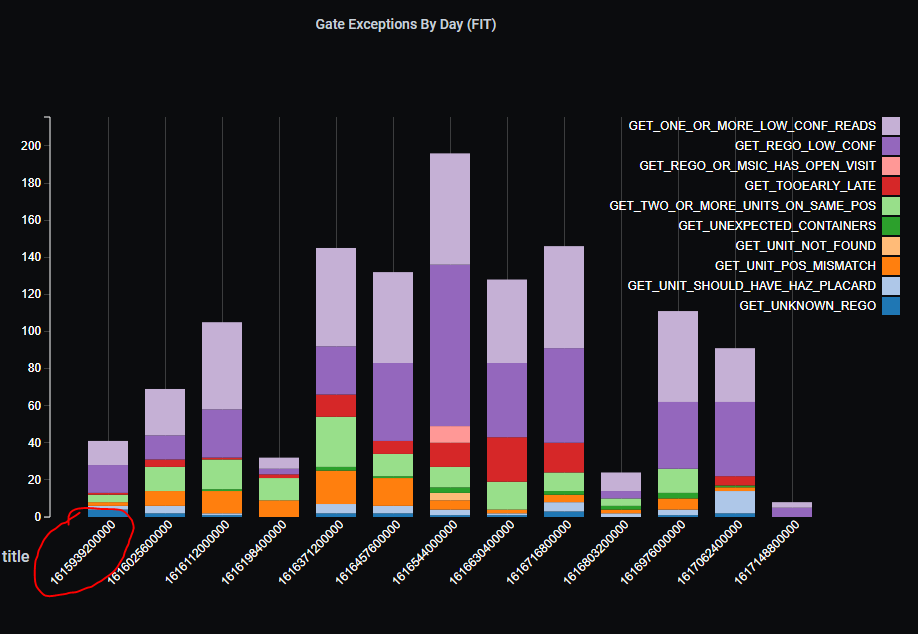
The remaining issue currently is getting the X Axis title for the day to be interpreted as a date not a number. Ideally formatted as say 18Mar21 for example
Any ideas how I might fix the image below?
I am new to Grafana and finding the elastic search query interface in Grafana less than intuitive…