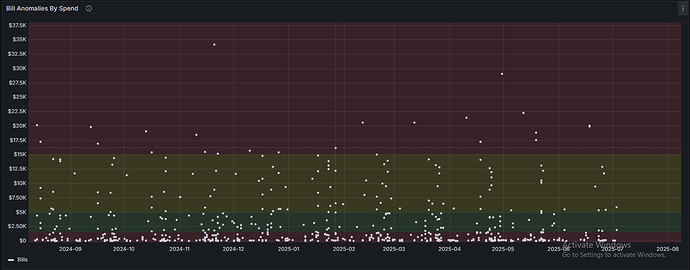
I am displaying anomaly data in the Time series panel.
-
Panel type: Time series
-
Graph style: Points
The issue is that some points are clickable (showing their tooltip/data when clicked), but others are not. I have confirmed that the data exists for all points, yet certain points cannot be clicked or interacted with, while others work fine.
query used to find the data to show:
SELECT
b.billid,

b.periodfrom,

SUM(daily.spend) AS newcharges
FROM billstatement b
JOIN (
SELECT billid, spend, usage FROM electricity_daily

UNION ALL

SELECT billid, spend, usage FROM gas_daily

UNION ALL

SELECT billid, spend, usageingallons FROM water_daily

UNION ALL

SELECT billid, spend, usage FROM sewer_daily
) AS daily ON b.billid = daily.billid
JOIN public.invoiceaccount ia ON b.accountid = ia.uid
WHERE
b.partnerid::text = '${partnerid}'

AND $\__timeFilter(b.periodfrom)
GROUP BY
b.billid, b.periodfrom
ORDER BY
b.periodfrom DESC;
Here is the snapshot:
Hello @securitye310 ,
kindly provide sample data reflecting the issue to help us replicate and resolve it effectively. Ensure it includes relevant cases and matches the original data format.
Thanks
Hi
thanks for giving reply,
I am adding some json data here.
[
{

    "id":1,

    "date":"2025-08-02 05:30",

    "charges":117.3408

},

{

    "id":2,

    "date":"2025-08-02 05:30",

    "charges":79.97

},

{

    "id":3,

    "date":"2025-07-17 05:30",

    "charges":244.89

},

{

    "id":4,

    "date":"2025-07-17 05:30",

    "charges":382.941

},

{

    "id":5,

    "date":"2025-07-15 05:30",

    "charges":244.89

},

{

    "id":6,

    "date":"2025-07-14 05:30",

    "charges":864.8101

},

{

    "id":7,

    "date":"2025-07-09 05:30",

    "charges":259.338

},

{

    "id":8,

    "date":"2025-07-04 05:30",

    "charges":3652.9812

},

{

    "id":9,

    "date":"2025-07-04 05:30",

    "charges":3272.1315

},

{

    "id":10,

    "date":"2025-07-03 05:30",

    "charges":5894.2587

},

{

    "id":11,

    "date":"2025-07-03 05:30",

    "charges":1847.9802

},

{

    "id":12,

    "date":"2025-07-03 05:30",

    "charges":1885.05

}\]
