Hello,
I have Grafana graphing influxDB data. I’m not sure where the issue is, but when I push data into influx, and graph it with Grafana, the data is 1 hour behind. I’m running this on a Raspberry Pi, and the system time and time zone is correct.
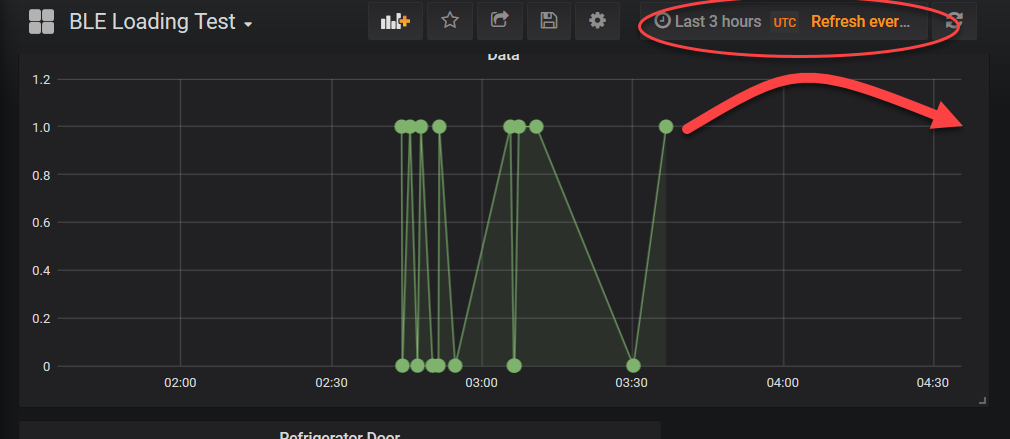
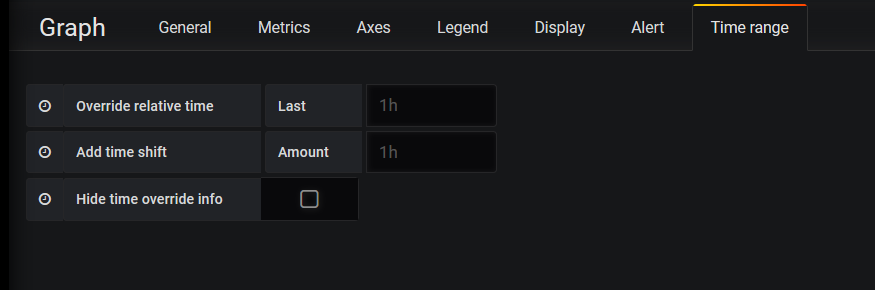
Below, the interval is now to now-3hours. I’m pushing that data just now, so it should be all the way on the right side of the graph. Instead, it’s showing up 1 hour in the past. I have no overrides in the Time Range tab, and no time shifts. The correct behavior should be new data showing up all the way on the right.

Just for completeness, here’s the date shown on the system:
![]()
I’ve also tried changing the timezone in Grafana, from default to browser to UTC…but doesn’t help. The data never shows up all the way on the right, or the “current” time.