where should i write this , in the template or query or Legend format…
Read the prometheus docs on how the query language works, it has some examples for how to group metrics by label
thank you so much i will read it first , so kindly of you 
Hello,
I’m using Grafana to Monitor 70+ server’s using datasource prometheus and node_exporter (agents). I expect to get all server stats like CPU, memory, load etc in single graph but for me it’s getting each individual graph for each server metirc i dont want that. I’m looking to get all server’s metrics in single graph. Could you please help me out this. This is what i can see
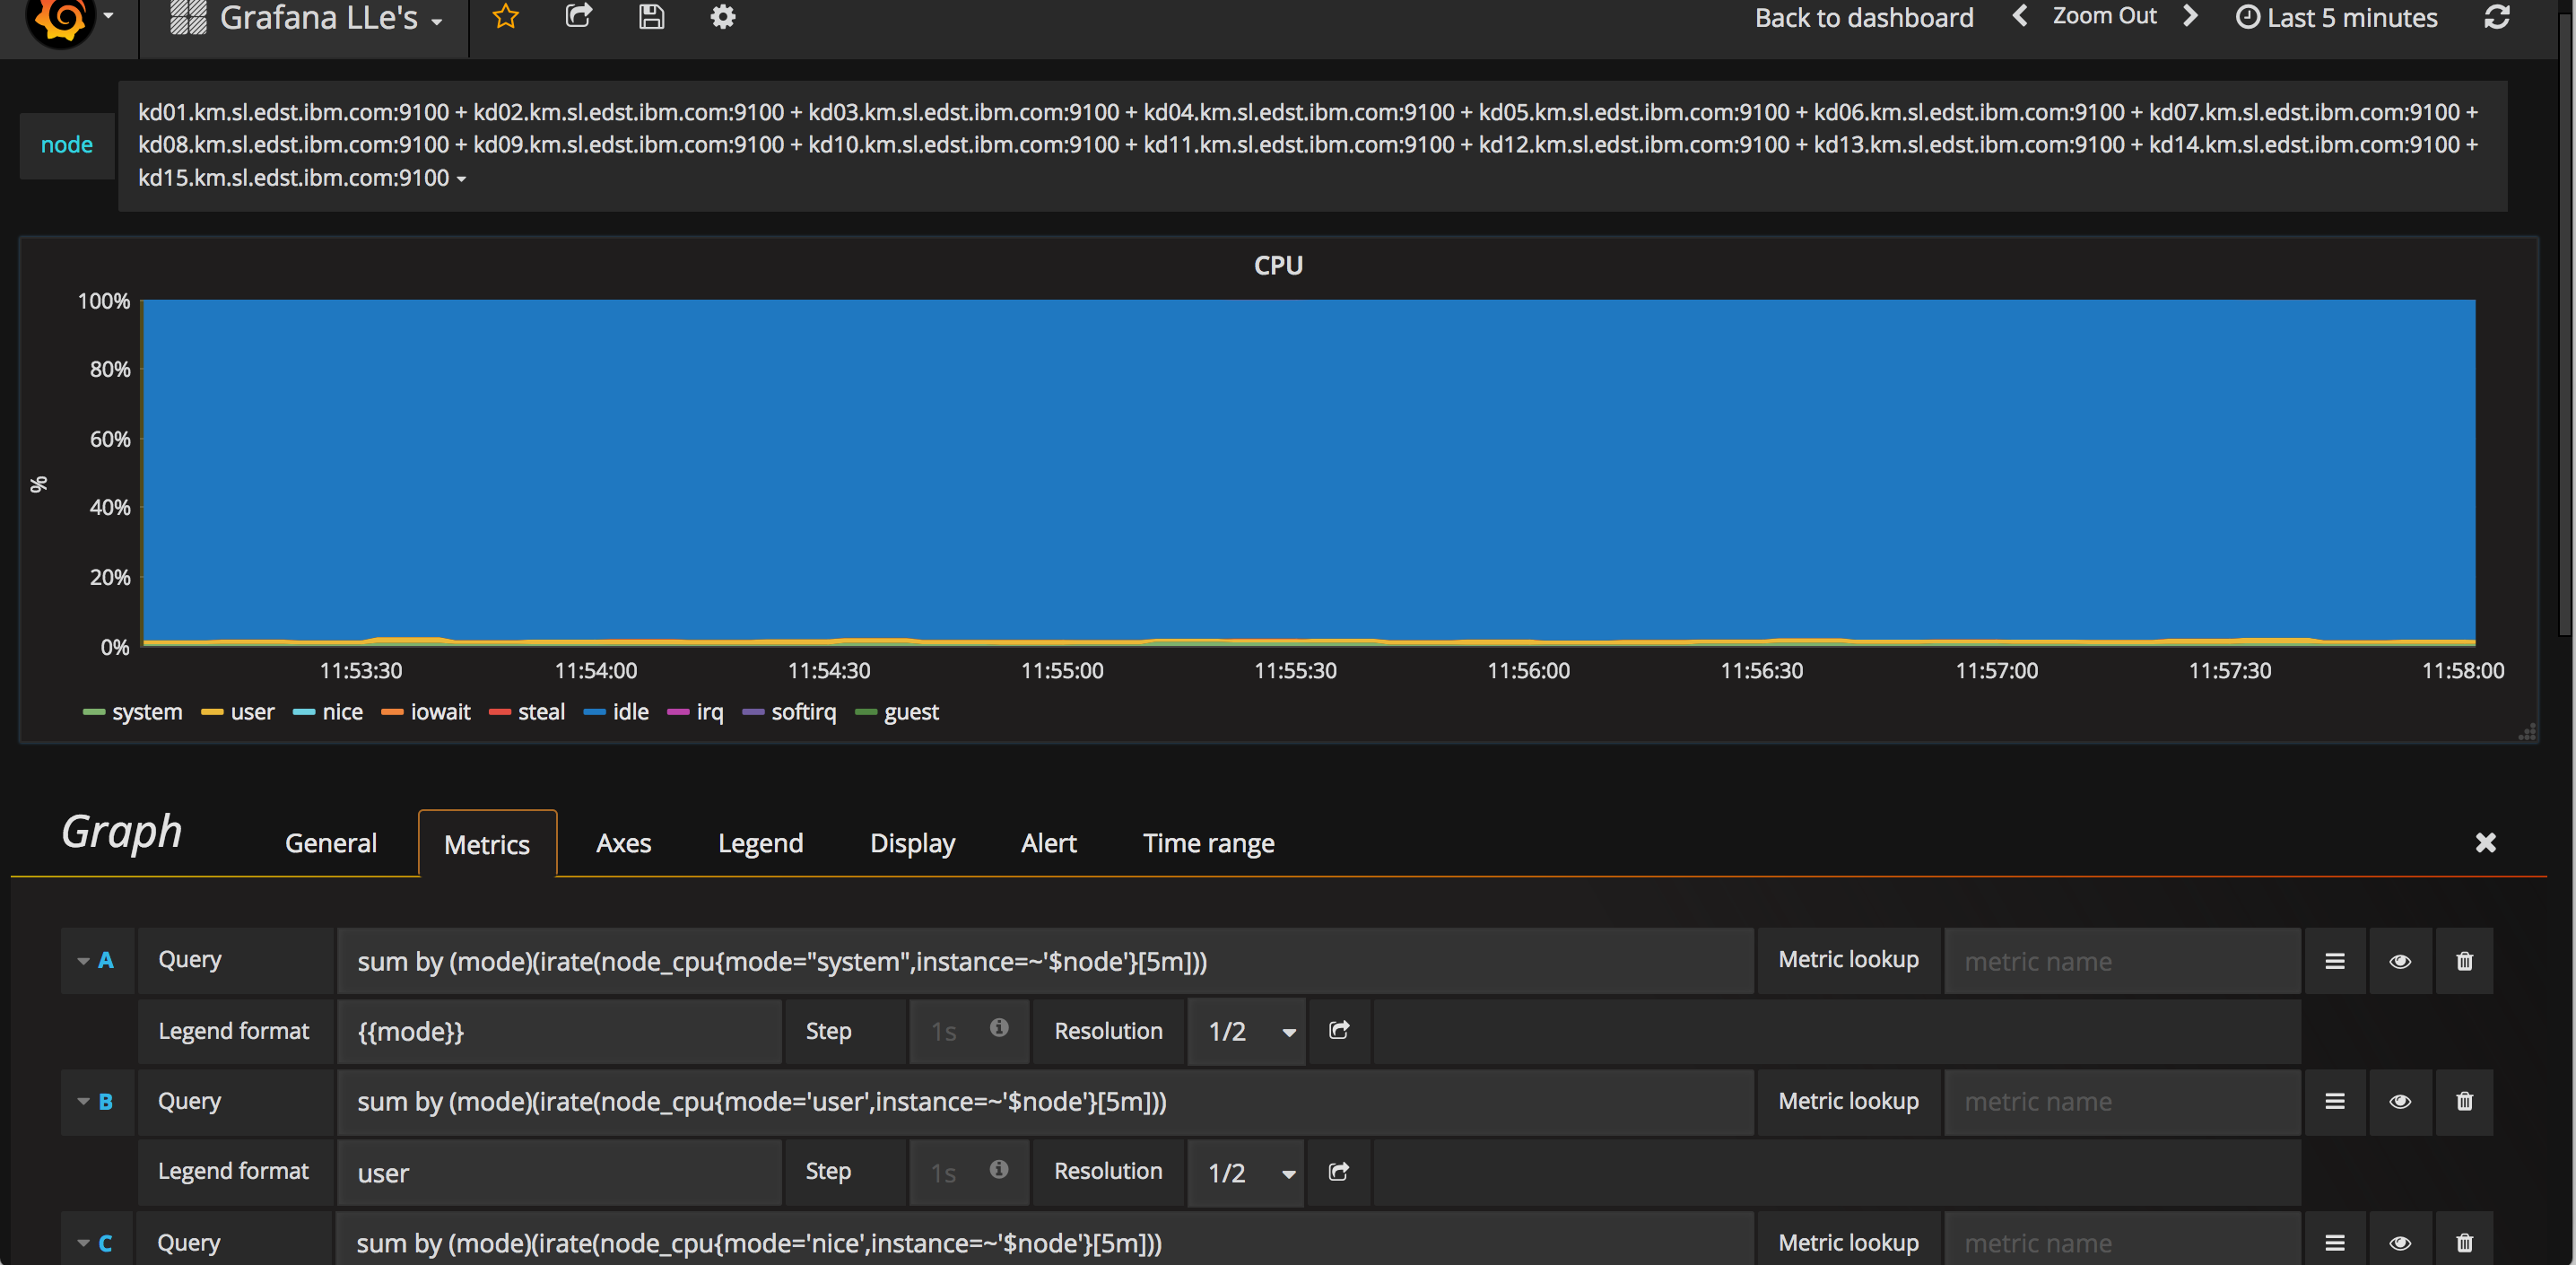
can someone please update !
Eh? If you put all your queries in a single graph panel you get all stats in a single graph. Maybe your using a templated dashboard with panel repeates? You need to rebuild your dashboard to match what you desire
Thanks for your inputs, could you please provide sample example for using all queries in a single graph because i’m using grafana first time not sure about queries. Moreover, if you give the steps to rebuild the dashboard to match that would be more help full/great.
Thanks!
Srikanth
Look at play.grafana.org there are lots of examples there
In play.grafana.org i couldn’t see the query which i required. Ex: i would like to monitor 70+ server’s so i need all 70+ servers CPU, MEMORY, DISKSPACE etc in single panel/graph i need that query. I didn’t see this in play.grafana.org. Could you please help me out this would be appreciated.
Open Graph in Edit mode, go to metrics tab, hit add query button to add more queries
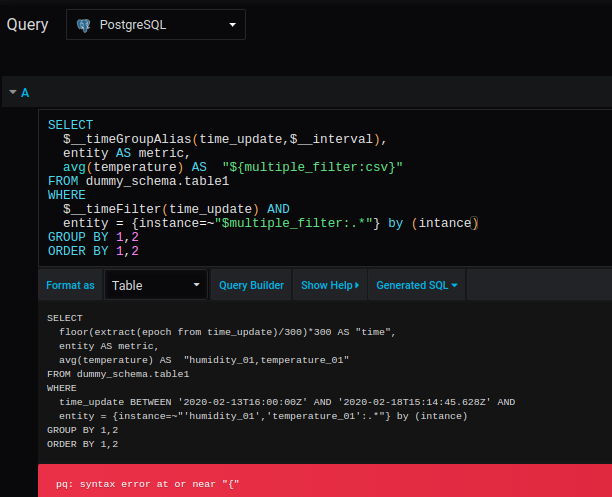
Hi, I am using postgres, any idea for the error, thanks in advance
Can someone please suggest on what formula to use in alias (legend) for trend, as my variable comes from JSON data source result. it maps between id -> name, id is used in InfluxDB stored data but to user I want to show meaningful name for id
- the variable drop-down menu shows name - OK
- the query returns valid series (even for multiple selected tags) - OK
- but the legend is still showin still the IDs not names
thanks in advance
M
This advice is just applicable to Prometheus, not Postgres. First read the Query Variable chapter in the Using PostgreSQL in Grafana documentation page (linked below) and open a new thread if that doesn’t solve your problem so that people can find and answer your question.
Can you open a new thread with your question and include as much information as possible (pictures are nice!) so that your question is as easy to find as possible for someone who’s capable of answering?
Any possible way to plot the average of these two lines?
Hello, somebody can help me?
I’m using Microsoft SQL Server datasource with Grafana. I use multi-value variable too, but it’s not running properly. When I choose more than one options the graph is not showing the data until I click “Query Inspector” in metric panel setting. I don’t know why it happened. There’s no problem when I choose only one variable.
