This is my first post, I hope Im putting it in the right place and adding all the information you need for helping me.
Im facing some issues when Im trying to show 2 metrics in the same chart, find below some information:
I have defined 3 variables:
Env & Period variables will determine the Jobs that I need to query.
The Method is multi-selection and will determine the metrics I would like to see in the chart.
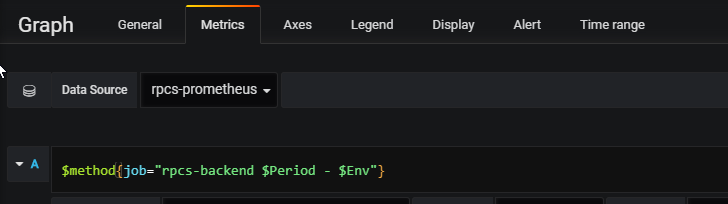
The metric implementation is the one you can see below:
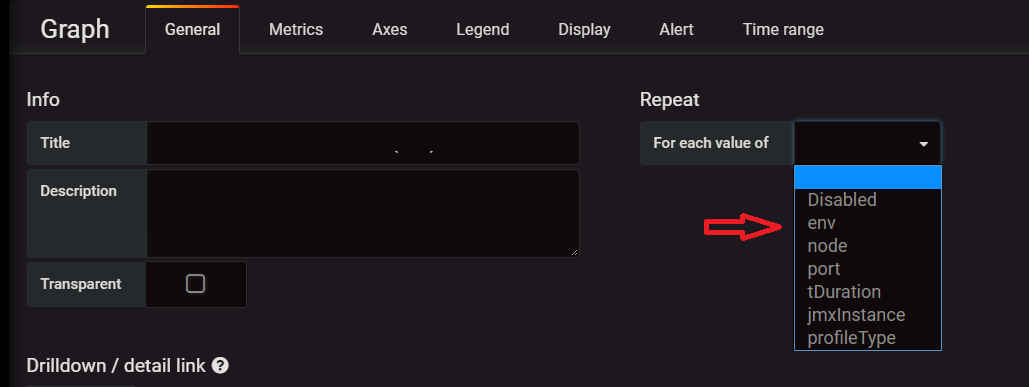
The point here is that as the Method Variable is multiselect, I would like to see dependind on the selection, one line for each of the selection… I was trying for a lot of times but I was not able to do that… if you can help me would be appreciated.
This is my first post, I hope Im putting it in the right place and adding all the information you need for helping me.
Im facing some issues when Im trying to show 2 metrics in the same chart, find below some information:
I have defined 3 variables:
Env & Period variables will determine the Jobs that I need to query.
The Method is multi-selection and will determine the metrics I would like to see in the chart.
The metric implementation is the one you can see below:
The point here is that as the Method Variable is multiselect, I would like to see dependind on the selection, one line for each of the selection… I was trying for a lot of times but I was not able to do that… if you can help me would be appreciated.
The error when I have more than one selection is this: