Hello!
I’m trying to use the Geomap panel to display a set of AIS vessel tracks that we obtain using an AIS antenna. The data is saved in an InfluxDB. We query the data using Flux.
I can query the database for all currently existing AIS tracks in the database. However, I can not get a single geomap panel to show me all AIS tracks from a given time frame. I can only see one route. Is it possible to use a single Geomap panel to display multiple tracks, where we do not know the number of tracks in advance? we could have zero to many tracks at each selected time frame.
I checked this post. However, I was not able to distill a solution out of it.
We save our data with the following fields:
- mmsi: int
- lat: float
- lon: float
- shipname: string
We add the data to influxdb as is and set the tag ship_id to the value of the mmsi field.
We then run the following FluxQuery (I’m new to Flux, so I think this could be improved):
import "influxdata/influxdb/schema"

from(bucket: "test")
  |> range(start: v.timeRangeStart, stop: v.timeRangeStop)
  |> filter(fn: (r) => r["_measurement"] == "ais")
  |> filter(fn: (r) => r["_field"] == "lat" or r["_field"] == "lon" or r["_field"] == "mmsi")
  |> drop(columns: ["_start", "_stop", "_measurement"])
  |> map(fn: (r) => ({ r with _value: string(v: r._value) }))  # necessary because otherwise group would not work.
  |> group(columns: ["ship_id"])
  |> schema.fieldsAsCols()
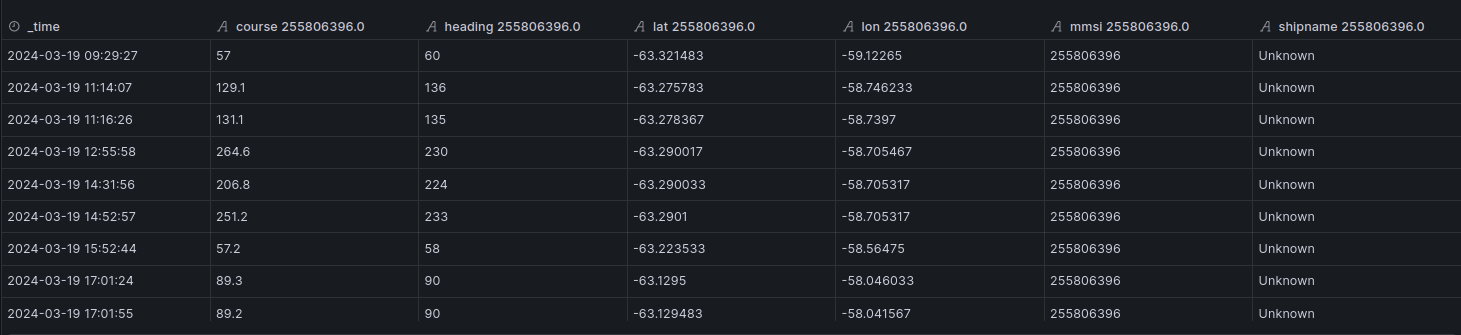
Here is some of the data we get when running the query:
,result,table,_time,ship_id,lat,lon,mmsi,shipname
,,0,2024-01-15T21:01:04.925Z,246573000.0,-63.20378,-58.0208,246573000,Unknown
,,0,2024-01-15T21:01:05.934Z,246573000.0,-63.203733,-58.020762,246573000,Unknown
,,0,2024-01-15T21:01:06.942Z,246573000.0,-63.203558,-58.020695,246573000,Unknown
[...]
,,0,2024-01-15T21:09:45.589Z,246573000.0,-63.147812,-57.688507,246573000,PLANCIUS
,,1,2024-01-15T20:48:50.561Z,725000349.0,-63.253,-57.989563,725000349,Unknown
,,1,2024-01-15T20:48:52.582Z,725000349.0,-63.253,-57.989563,725000349,Unknown
,,1,2024-01-15T20:48:53.578Z,725000349.0,-63.253042,-57.989533,725000349,Unknown
,,1,2024-01-15T20:48:54.581Z,725000349.0,-63.253157,-57.989543,725000349,Unknown
,,1,2024-01-15T20:48:55.592Z,725000349.0,-63.25327,-57.989577,725000349,Unknown
[...]
As you can see, we get two tables. As far as I understood the geomap panel, we can display multiple routes if we can get one table per track. In this example, we have two tracks in our database and each is displayed in its own table.
If I run this query in Grafana with the Geomap panel and a route layer, I get the following result:

If I open the table view, I see that we have two tables:

However, Grafana is not able to show the two tracks.
If we do not use a tag and use a grafana transformation to group the tracks, we can see both tracks in the same Geomap. However, both tracks are connected.
Could it be that the route layer can not be used at all for the envisioned task?
We are using GrafanaOSS in Version: v10.2.3 (1e84fede54)
Thank you for reading this and your help is greatly appreciated =)
If you need any further information, let me know.