Can't get Geomap to display data from influx

I am trying to get Geomap to show markers for data that i have saved in a InfluxDb but I can’t get markers to show on the map.

Here is an extract of the CSV file I get from Influx:

Blockquote
Time,“position.latitude”,“position.longitude”
1709341104000,45.53124,-73.56343
1709341464000,45.83088,-73.60837
1709341824000,45.6789,-73.91201
1709342184000,45.69702,-73.93177
1709342544000,46.03001,-74.20713
1709342904000,45.65876,-73.85649
1709343264000,45.65907,-73.85757
1709343624000,46.11559,-74.56937
1709343984000,45.58284,-73.87479
1709344344000,45.8203,-74.04824
1709344704000,45.79109,-74.01807
1709345064000,45.73196,-75.05371
1709345424000,45.696,-73.61478
1709345784000,45.63686,-73.98493
1709346144000,45.76596,-74.01959
1709346504000,45.77335,-74.00211
1709346864000,45.73947,-74.13766
1709347224000,45.76998,-74.11947
1709347584000,45.76998,-74.11947
Blockquote

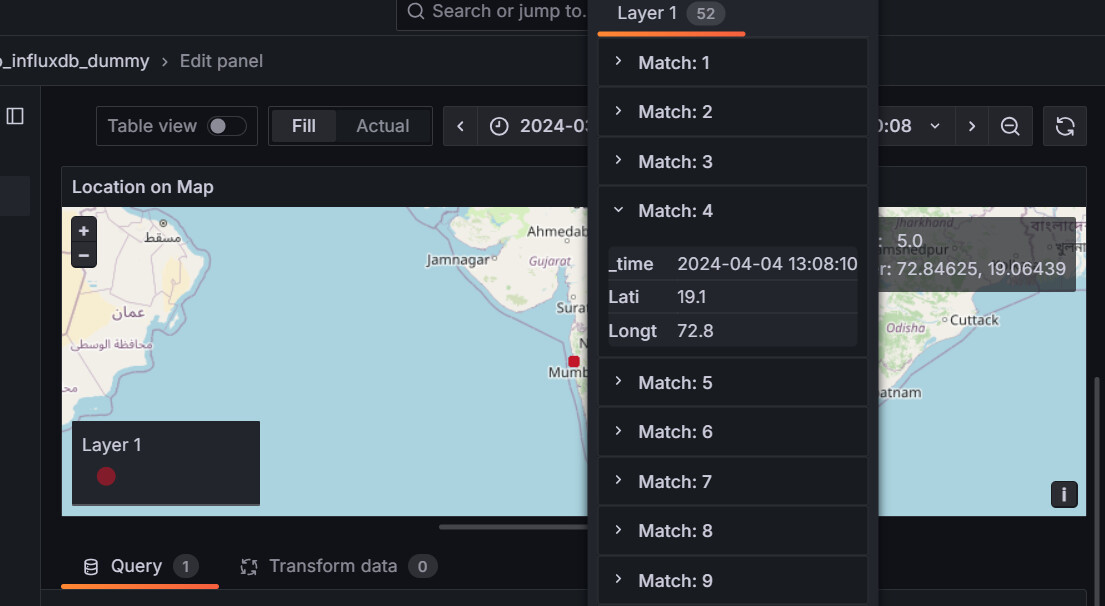
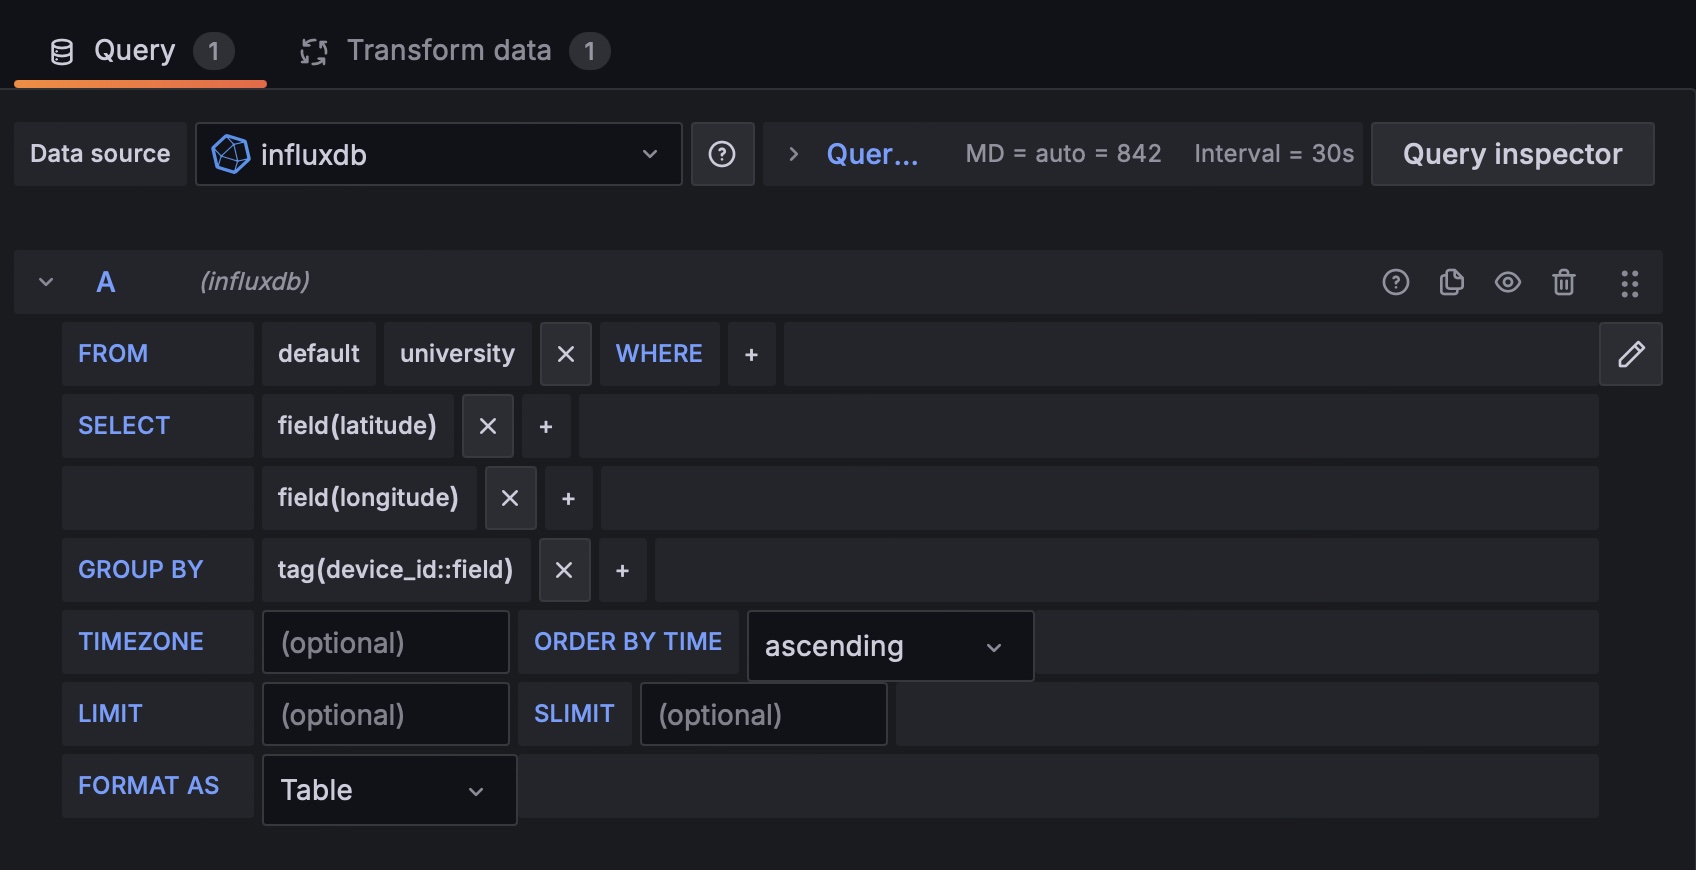
I tried changing the Location Mode and I have the “Select latitude/longitude fields” message showing if I select Coords Location mode even If I select both latitude and longitude fields OR If I select the Auto Mode I have the “Unable to find location fields”.

Can anyone give me some guidance what I am doing wrong ?

1 Like

hey did you got the solution for this geomap issue?

please share your data sample as csv or line protocol @shobhamaurya2002


I want to locate Lati and Longt on the geomap.

Are you using flux query languagr or influxql

Also you might need to transform the lat lon columns to number using transformation

I am using flux as query language.
I’ve written query as-
from(bucket: “Dummy_Lovato”)
|> range(start: -1d)
|>filter(fn:(r)=>
r._measurement==“Data” and
r._field == “Lati” or
r._field == “Longt”
)
|> pivot(rowKey:[“_time”], columnKey: [“_field”], valueColumn: “_value”)
|> drop(columns: [“_start”, “_stop”, “_measurement”, “type”])

And getting my location marked as this shown picture below. But now the only thing is that when I click on the marked location I am getting history displayed as well as shown below in match section.

So can you help me what other thing I should add in my query so that when I hover on the marked location then it will show the latest received data only, although every time it is receiving the same location only.

Try using the “Join By Field” transform. Mode = “Outer time series”

Yeah I tried that but doesn’t worked for me still showing as above attached image.

I have the same problem. I use InfluxQL to query the db: SELECT last("device_id") AS "deviceID", "latitude", "longitude" FROM "university" WHERE $timeFilter . and I use a Transform data to hide the Time column.
In the table view, I have 3 columns: deviceID, latitude, longitude and the data are present. When I switch to the map view, there is no marker displayed.
Could you please help ?

welcome @papyetlesresistances

what do you see when you open the data view

By data view, you mean Table view ? If you do, I see a table with 3 columns: deviceID, latitude, longitude and 1 row (there is only one device for now) with the data: eui-xxxx, 48.7, 2.21

this data view

could be that you need to convert lat and lon using transformation

image

What kind of transformation should I use ?

image


I have done this but it doesn’t work either

1 Like

Do you think the problem is coming from InfluxDB, I have seen many people with the same kind of issue ? What could the second choice to replace it ?

i dont think that is the issue. no idea why it wont work. if you are able to see the data in data view, it should work

Make sure Format is Table and not Time Series

Yes I confirm that I use Table. But something is weird. I have added a second device and I don’t get the right table at the end: only one device_id is kept in the table which is the last one. This is because I use the attached query with the function last(). If I remove the last() function, I get a table with multiple entries but with a lot of duplicates (with time) since my devices don’t move. See the 2nd figure.


How can I keep only the last lat, long values for the 2 devices ?

does the mapping work? which is the original issue

I managed to create a table with a slightly different request and


a transformation but I doesn’t work either

My conclusion is that this is a Grafana bug. I contacted the support but they replied they can only do that for the cloud version.