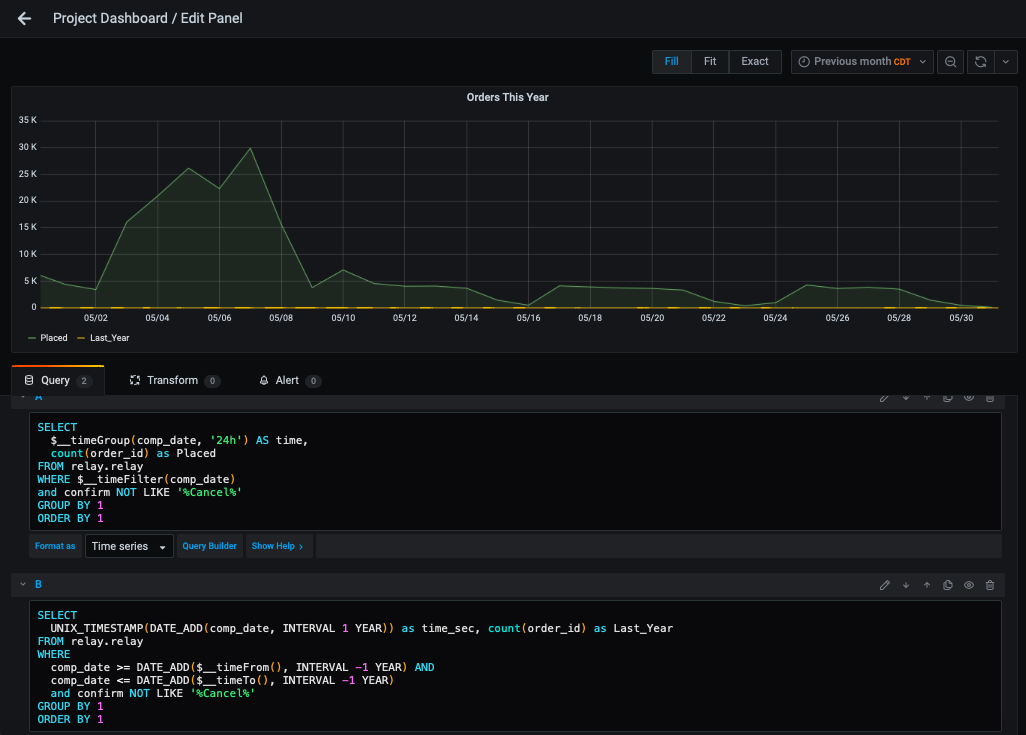
fantastic job with this application, it is getting better a better by the day. I would like to display in the same graph this month and last year month. I was thinking to create two queries, Query A for this month and query B for last year month. Unfortunately I’m having issues with last year month. The query should be based on the ranges that I select and subtract by a a year. The first query “A” I have is something like this, how do a create another query “B” to dispay last year data?
SELECT
UNIX_TIMESTAMP(datecreated) as time_sec,
max(devicevalue) as value,
‘KWH’ as metric
FROM history
WHERE $__timeFilter(datecreated) and deviceroom = ‘Energy Monitor’ and devicename = ‘Total KW Hours’
group by HOUR(datecreated)
If you’re using mysql 8 or later you may be able to use windowed function. Otherwise think you need to filter time using the __timeFrom/__timeTo instead of $__timeFilter. Then you should be able to use mysql builtin datetime function to timeshift back 1 year in your second query.
Would it be possible to do some print screens of what you are envisioning? I would very much appreciate your help since I spent about 5 hours trying to figure it out
SELECT
  UNIX_TIMESTAMP(DATE_ADD(datecreated, INTERVAL 1 YEAR)) as time_sec,
  ...
FROM ...
WHERE
  datecreated >= DATE_ADD($__timeFrom(), INTERVAL -1 YEAR) AND
  datecreated <= DATE_ADD($__timeTo(), INTERVAL -1 YEAR)
ORDER BY ...
thanks for your continued help, unfortunately it looks like that it is returning this year data, at least from what I can see from the dot on the screen
Ideally I would like to display something similar to this, sorry if I sound confusing. If I create a query A with this year query and query B with the query you have outline, Grafana will display “Data points outside time range” if I add a time shift of one year than it will not show this year.
The custom range is from 2018-01-01 to 2018-11-26. Sorry about the confusion so far.
@anon34853223, I will try it,alghouth I think the issue is doing the quey and selecting the date range that is outside that query range, this is what I normally get when I run the query outside these ranges. Grafana will display “Data points outside time range
@gaurav24, this looks interesting, I will try it this weekend. From the reading, it sounds like it will work with Mysql, correct?
Your using the Meta Queries plugin. I cannot help you with that since it’s a plugin (not included in Grafana core). I would suggest you first try and get a working query using only your mysql datasource.
@mwfraimsson, I tried everything in my power to make it work, unfortunately everything that I do, does not work. Another suggestions would be appreciated.
@alphatech the idea would be to get query A working and then add B.
In case A is working, B has an issue. for B. Query should be “A” and Metric should be “value”
Hi Robby,
Did you managed to fix this? I mean now are you able to show the current and Last year data? If yes, can I know what you have done to show both the data