My openwrt router got a log file named /root/ddns.log with below pattern,
2025-07-08_13-22-29 - Pattern matched. Running script...
2025-07-08_13-22-29 - ###################################### START ##########################################
2025-07-08_13-22-29 - new prefix is 2xxx:xxxx:51:50e6
2025-07-08_13-22-48 - ###################################### END ############################################
I am using promtail with below config.yaml to push above logs to loki,
server:
  http_listen_port: 9080
  grpc_listen_port: 0

positions:
  filename: /tmp/positions.yaml

clients:
  - url: https://192.168.0.10:3100/loki/api/v1/push
    tls_config:
      insecure_skip_verify: true

scrape_configs:

- job_name: ddns-logs
  static_configs:
  - targets:
     - ddns-logs
    labels:
      job: ddns-logs
      host: openwrt
      __path__: /root/ddns.log
loki is added as datasource in grafana. I am using Grafana v12.0.2.
I would like to setup an alert such a way that, Whenever ddns.log get new entry of 2025-07-08_13-22-29 - new prefix is 2xxx:xxxx:51:50e6, I need to get a telegram notification from grafana which should contain below information, ip prefix changed at date-time and new ip prefix is 2xxx:xxxx:51:50e6
Can any one help on this please?
Note: Already telegram is added as a contact point and tested.
Thanks.
If your intent is to create an alert from Grafan, it should be pretty straight forward.
First, you can use pattern filter to get the time and prefix from your log. Put count_over_time around it, then you can use it as a condition. For example:
sum by (datetime,prefix) (count_over_time({<LABEL_FILTER>} | pattern "<datetime> <_> new prefix is <prefix>" [1m]))
Then you can use {{ .datetime }} and {{ .prefix }} in your alert description and message to write whatever you want.
Thank you for the response
I tried the rule as below,
1st issue is - whenever alert comes it still not containing “prefix changed at {{ .datetime }} and new prefix is {{ .prefix }}”
2nd issue is - every now and then I get notification saying “Rule: DatasourceNoData”. This log file will have new events only occasionally.

I produced events in log and here is query results from Explore
sum by (datetime,prefix) (count_over_time({filename="/root/ddns.log"} | pattern "<datetime> <_> new prefix is <prefix>" [1m]))
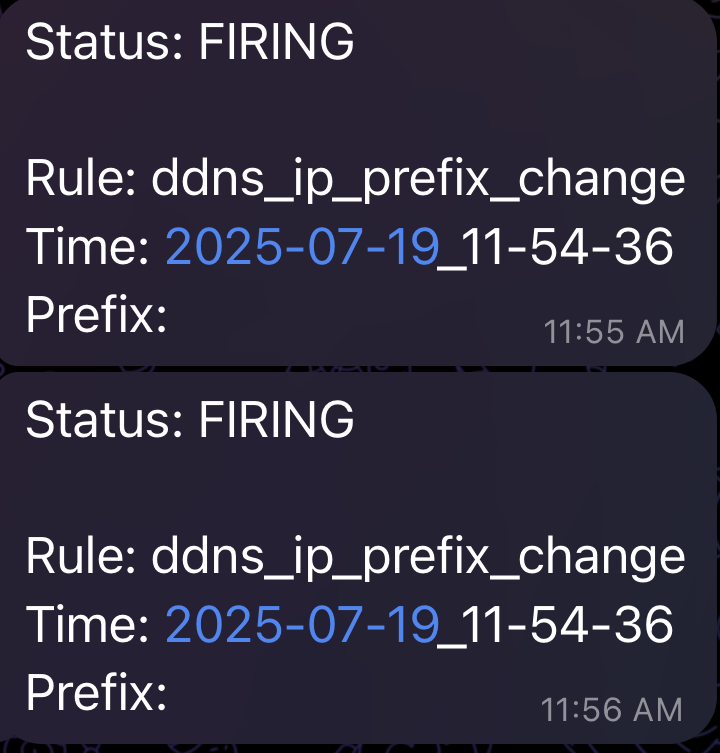
And I got telegram notification as below,
Few more details about the contact point setup,
Well, since your logs aren’t uniformed you need to filter for what you want first so you aren’t being alerted for logs that aren’t relevant. Something like:
sum by (datetime,prefix) (
  count_over_time(
    {<LABEL_FILTER>}
      |= "ip prefix changed"
      | pattern "<datetime> <_> new prefix is <prefix>" [1m]
  )
)
With the threshold > 0
Before updating the alert, I tested the query on explore first.
I first made sure that new logs are produced and then ran the new query, but no result showing up
Sorry I responded too soon, I slightly changed the query as below,
sum by (datetime,prefix) (
  count_over_time(
    {filename="/root/ddns.log"}
      |= "new prefix is"
      | pattern "<datetime> <_> new prefix is <prefix>" [1m]
  )
)
And it showed result as below,
Updated the alert with same query and produced new logs, now telegram alert came as below,
All good so far. I will now wait and see if I get more of below alerts
I am still getting below occasionally. Any thoughts on how to fix that?
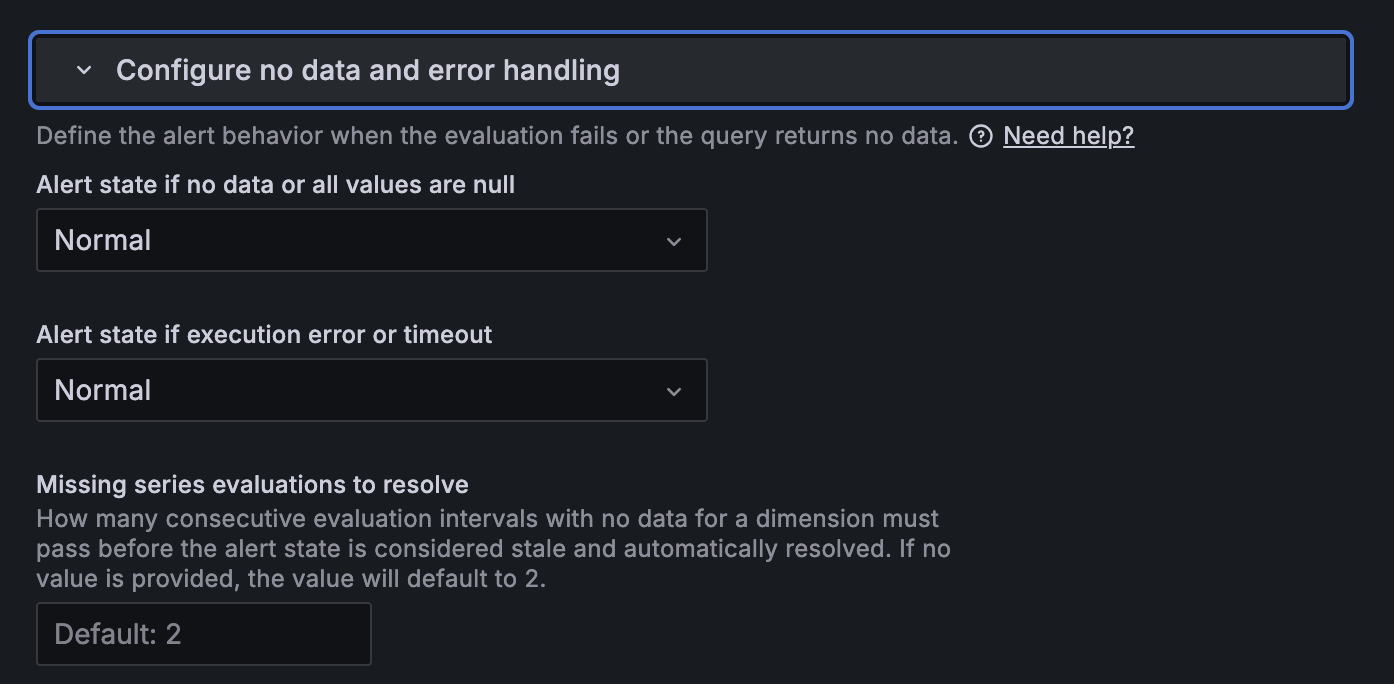
One question I have is, what is the relevance of below configuration in my alert, This is not the format I get the message on. It is based on my contact point notification template.
In grafana you can configure an alert to not fire if there is no data: