Set Field-Alias from Influx-Query

Hey,
I set up a InfluxDB (6.3.5) providing data for my grafana (v9.4.3).
Via ioBroker-adapter I want to make price comparisons visible in grafana dashbard.
So I created multiple Influx-Queries, like:

from(bucket: "iobroker")
  |> range(start: v.timeRangeStart, stop:v.timeRangeStop)
  |> filter(fn: (r) =>
    r._measurement == "heizoel.0.hoe3000.Items01.UnitPrice" and
    r._field == "value" 
  )

The datasource also provides a related dealer name to my unit price. In my time series in the actual state, there is only the measurement title like “heizoel.0.hoe3000.Items01.UnitPrice”

image

Is there a way to link up the unit price to the related dealer name (heizoel.0.hoe3000.Items01.Name) so the value is shown in my dashboard?

Thanks a lot

Hi @gollerandre,

Welcome to the :grafana: community support forums !!

We are excited that you joined our OSS community. Please read about some of the FAQs in the community :slight_smile:

Though I am not an expert with influxDB but I am sure that you can do this on the query level.

Also as an alternative, you can do this on the Grafana UI to rename the labels to your given custom name. You can check this post which contains a . GIF that explains how to do it using the override function.

I hope this helps.

Hi @usman.ahmad ,

thanks for the quick reply. I already know and use the described way to set static descriptions in other dashboards.

I guess we have to use a query here:
I have a iobroker-adapter that collects folders from 1 to 5 (folder one contains the best and cheapest supplier)
When another supplier has a better price/conditions he is raises between the folder numbers.
So in my timeline, the best price has to fit to the related supplier.

I just want the description on the bottom of my “price-timeline” related dynamic to the graph.

Hope this descriebes my problem better.

Best regards

Thanks.

I have moved this post to influxDB category as seems more fitting.

Hopefully a community member can help you how to do achieve this on query level.

Hi @gollerandre,
If I understood you correctly you have two measurements per folder and main problem is joining corresponding values and dealer names (e.g. Items01.UnitPrice and Items.01.Name). Joining tables is needed because (dealer) Name is not used as a tag to UnitPrice value.


Data that I used to simulate

Items01.UnitPrice:

#datatype measurement,tag,double,dateTime:RFC3339
m,host,value,time
heizoel.0.hoe3000.Items01.UnitPrice,influxdb,100.0,2023-04-11T00:00:00Z
heizoel.0.hoe3000.Items01.UnitPrice,influxdb,110.0,2023-04-11T04:00:00Z
heizoel.0.hoe3000.Items01.UnitPrice,influxdb,120.0,2023-04-11T08:00:00Z
heizoel.0.hoe3000.Items01.UnitPrice,influxdb,150.0,2023-04-11T12:00:00Z
heizoel.0.hoe3000.Items01.UnitPrice,influxdb,90.0,2023-04-11T16:00:00Z
heizoel.0.hoe3000.Items01.UnitPrice,influxdb,93.0,2023-04-11T20:00:00Z
heizoel.0.hoe3000.Items01.UnitPrice,influxdb,113.0,2023-04-12T00:00:00Z
heizoel.0.hoe3000.Items01.UnitPrice,influxdb,130.0,2023-04-12T04:00:00Z
heizoel.0.hoe3000.Items01.UnitPrice,influxdb,135.0,2023-04-12T08:00:00Z
heizoel.0.hoe3000.Items01.UnitPrice,influxdb,155.0,2023-04-12T12:00:00Z
heizoel.0.hoe3000.Items01.UnitPrice,influxdb,155.0,2023-04-12T16:00:00Z
heizoel.0.hoe3000.Items01.UnitPrice,influxdb,155.0,2023-04-12T20:00:00Z
heizoel.0.hoe3000.Items01.UnitPrice,influxdb,165.0,2023-04-13T00:00:00Z
heizoel.0.hoe3000.Items01.UnitPrice,influxdb,155.0,2023-04-13T04:00:00Z
heizoel.0.hoe3000.Items01.UnitPrice,influxdb,120.0,2023-04-13T08:00:00Z
heizoel.0.hoe3000.Items01.UnitPrice,influxdb,115.0,2023-04-13T12:00:00Z
heizoel.0.hoe3000.Items01.UnitPrice,influxdb,110.0,2023-04-13T16:00:00Z
heizoel.0.hoe3000.Items01.UnitPrice,influxdb,100.0,2023-04-13T20:00:00Z
heizoel.0.hoe3000.Items01.UnitPrice,influxdb,95.0,2023-04-14T00:00:00Z
heizoel.0.hoe3000.Items01.UnitPrice,influxdb,90.0,2023-04-14T04:00:00Z
heizoel.0.hoe3000.Items01.UnitPrice,influxdb,90.0,2023-04-14T08:00:00Z
heizoel.0.hoe3000.Items01.UnitPrice,influxdb,90.0,2023-04-14T12:00:00Z
heizoel.0.hoe3000.Items01.UnitPrice,influxdb,80.0,2023-04-14T16:00:00Z
heizoel.0.hoe3000.Items01.UnitPrice,influxdb,70.0,2023-04-14T20:00:00Z


Items01.Name:

#datatype measurement,tag,string,dateTime:RFC3339
m,host,value,time
heizoel.0.hoe3000.Items01.Name,influxdb,DealerA,2023-04-11T00:00:00Z
heizoel.0.hoe3000.Items01.Name,influxdb,DealerA,2023-04-11T04:00:00Z
heizoel.0.hoe3000.Items01.Name,influxdb,DealerA,2023-04-11T08:00:00Z
heizoel.0.hoe3000.Items01.Name,influxdb,DealerA,2023-04-11T12:00:00Z
heizoel.0.hoe3000.Items01.Name,influxdb,DealerA,2023-04-11T16:00:00Z
heizoel.0.hoe3000.Items01.Name,influxdb,DealerA,2023-04-11T20:00:00Z
heizoel.0.hoe3000.Items01.Name,influxdb,DealerB,2023-04-12T00:00:00Z
heizoel.0.hoe3000.Items01.Name,influxdb,DealerB,2023-04-12T04:00:00Z
heizoel.0.hoe3000.Items01.Name,influxdb,DealerB,2023-04-12T08:00:00Z
heizoel.0.hoe3000.Items01.Name,influxdb,DealerB,2023-04-12T12:00:00Z
heizoel.0.hoe3000.Items01.Name,influxdb,DealerA,2023-04-12T16:00:00Z
heizoel.0.hoe3000.Items01.Name,influxdb,DealerA,2023-04-12T20:00:00Z
heizoel.0.hoe3000.Items01.Name,influxdb,DealerA,2023-04-13T00:00:00Z
heizoel.0.hoe3000.Items01.Name,influxdb,DealerB,2023-04-13T04:00:00Z
heizoel.0.hoe3000.Items01.Name,influxdb,DealerB,2023-04-13T08:00:00Z
heizoel.0.hoe3000.Items01.Name,influxdb,DealerB,2023-04-13T12:00:00Z
heizoel.0.hoe3000.Items01.Name,influxdb,DealerB,2023-04-13T16:00:00Z
heizoel.0.hoe3000.Items01.Name,influxdb,DealerA,2023-04-13T20:00:00Z
heizoel.0.hoe3000.Items01.Name,influxdb,DealerA,2023-04-14T00:00:00Z
heizoel.0.hoe3000.Items01.Name,influxdb,DealerA,2023-04-14T04:00:00Z
heizoel.0.hoe3000.Items01.Name,influxdb,DealerA,2023-04-14T08:00:00Z
heizoel.0.hoe3000.Items01.Name,influxdb,DealerA,2023-04-14T12:00:00Z
heizoel.0.hoe3000.Items01.Name,influxdb,DealerA,2023-04-14T16:00:00Z
heizoel.0.hoe3000.Items01.Name,influxdb,DealerA,2023-04-14T20:00:00Z

Commands to import CSV to Influxdb:

influx write -b test -f /home/user/items01.csv
influx write -b test -f /home/user/name01.csv


InfluxDB query:

import "regexp"
import "join"

price01 = from(bucket: "test")
  |> range(start: v.timeRangeStart, stop: v.timeRangeStop)
  |> filter(fn: (r) => r["_measurement"] == "heizoel.0.hoe3000.Items01.UnitPrice")
  |> filter(fn: (r) => r["_field"] == "value")
  |> map(fn: (r) => ({r with ID: regexp.replaceAllString(r: /\.UnitPrice/, v: r._measurement, t: "")})) // removes .UnitPrice string from _measurement in order to get ID column
  |> drop(columns: ["_measurement", "_field", "_start", "_stop"])  // drop columns that we do not use
  |> group() // ungroup data, needed in order for join to work
//  |> aggregateWindow(every: v.windowPeriod, fn: mean, createEmpty: false) // uncomment for aggregation
//  |> yield(name: "price01")


name01 = from(bucket: "test")
  |> range(start: v.timeRangeStart, stop: v.timeRangeStop)
  |> filter(fn: (r) => r["_measurement"] == "heizoel.0.hoe3000.Items01.Name")
  |> filter(fn: (r) => r["_field"] == "value")
  |> map(fn: (r) => ({r with ID: regexp.replaceAllString(r: /\.Name/, v: r._measurement, t: "")})) // removes .Name string from _measurement in order to get ID column
  |> drop(columns: ["_measurement", "_field", "_start", "_stop"]) // drop columns that we do not use
  |> group() // ungroup data, needed in order for join to work
//  |> aggregateWindow(every: v.windowPeriod, fn: mean, createEmpty: false) // uncomment for aggregation
// |> yield(name: "name01")


join.left(left: price01, right: name01, on: (l, r) => l.ID == r.ID and l._time == r._time, as: (l, r) => ({l with dealer: r._value}))
  |> group(columns: ["_time", "_value"], mode:"except") // group data to get multiple series so that you can distinguish series by dealer
  |> yield(name: "result")


Result:

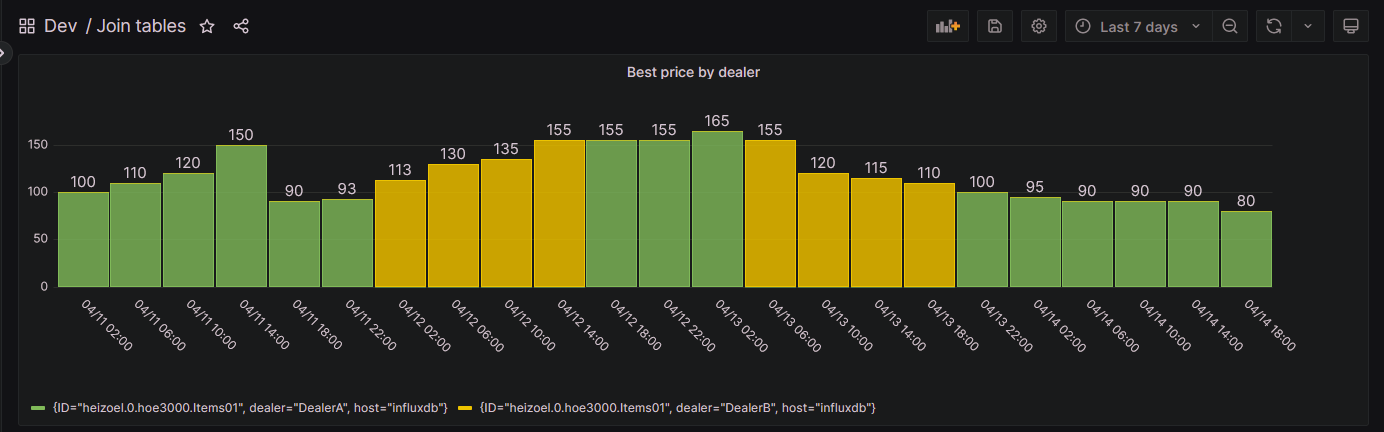
Here, only data from folder 01 is displayed (a.k.a best price/offer) per dealer as bar chart.


Best regards,
ldrascic

Hey guys and thanks for your replies. I found another possibility to show the required information with another layout.
But the solution from @ldrascic is a great idea for one of my other dashboards.

Thanks a lot