I have an InfluxDB that has multiple server data from Telegraf. I can see the data in Influx, I can query the data with Explore, and I can change the individual panels to get the data, but the drop down server variable doesn’t show the server:
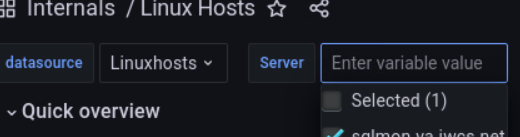
I have an InfluxDB that has multiple server data from Telegraf. I can see the data in Influx, I can query the data with Explore, and I can change the individual panels to get the data, but the drop down server variable doesn’t show the server:
Hi @jasonmallory,
Can you please check “datasource” and “Server” dashboard variables ?
Dashboard settings (cog icon) → Variables → datasource :
If you have both Influxdb v1 and Influxdb v2 datasources in grafana you should filter only Influxdb v1 (or Influxdb v2) in “datasource” variable. You can do that by specifying /database1|database2|database3/ under Instance name filter or by using regex if applicable e.g. /database.*/. You can’t have both influxdb versions in same “datasource” variable since queries in “Server” variable (which inherits “datasource” variable) are different.
After that check “Server” variable.
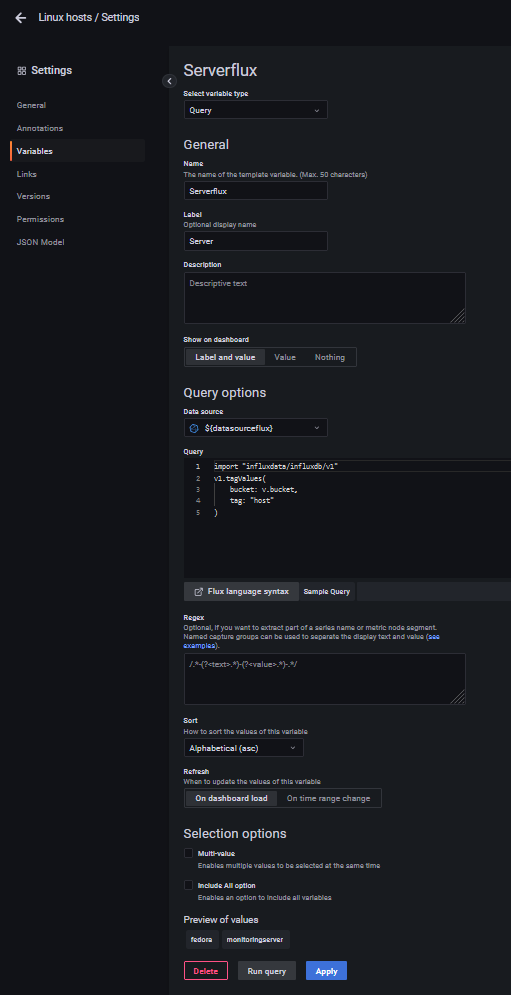
Select variable type:
query
Datasource:
${datasource}
Query (for influx v1):
SHOW TAG VALUES WITH KEY = “host”
Query (for influx v2 - FLUX):
import “influxdata/influxdb/v1”
v1.tagValues(
bucket: v.bucket,
tag: “host”,
)
For influx v2:
Also check if you have strings mentioned under Regex field which would filter out returned servers.