i had prometheus/grafana/node_exporter setup , i am trying to fix windows memory alerts through mail , alerts are coming fine but in grafana dashboard and in alerts mail , server ip or server identity is not displayed
my prometheus query is
100 - ((wmi_os_physical_memory_free_bytes * 100) / wmi_cs_physical_memory_bytes)
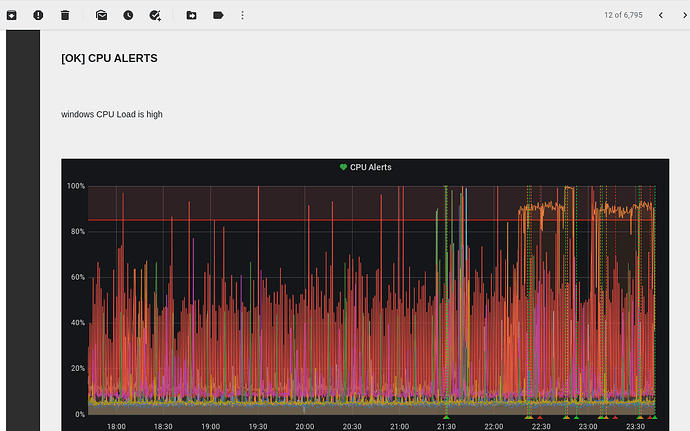
alert graph is displayed but not ip of server at the bottom
any clues to resolve this
Could you share a screenshot of your alerting configuration? And what version of Grafana are you using / are you using the new unified alerting system?
this is the screenshot of OK alerts mail which i could not identify which server is OK after alert,
only by using colour identification i could identify , anyways to get node name and server ip
for OK alerts in mail

