I have a several Grafana dashboards running that make use of either Telegraf or Python to write to v1 InfluxDB. With InfluxDB 2, everything is broken, and the learning curve is steep to get Telegraf and Grafana to work with it. I am looking for a complete package that has the full TIG stack for speedtest. Or failing that, a complete package with full TIG for just about anything, which would include a Telegraf xxx.conf file and a downloadable Grafana dashboard. For now a full example is much more valuable than an in-depth syntax reference manual.
Can you show us what you currently have?
Here is a shell of the telegraf configuration file that I had been using:
[[inputs.exec]]
commands = [“/usr/local/bin/speedtest --json”]
name_override = “speedtest”
timeout = “1m”
#interval = “30m”
data_format = “json”
json_string_fields = [ “interface_externalIp”,
“server_name”,
“server_location”,
“server_host”,
“server_ip”,
“isp”,
“name”,
“result_url” ]
I don’t recall which Grafana dashboard I eventually use, but all the ones I can find assume an InfluxDB v1 database (that is, database, not bucket). I have tried the following telegraf configuration file with InfluxDB v2:
[[outputs.influxdb_v2]]
The URLs of the InfluxDB cluster nodes.
Multiple URLs can be specified for a single cluster, only ONE of the
urls will be written to each interval.
ex: urls = [“https://us-west-2-1.aws.cloud2.influxdata.com”]
urls = [“http://localhost:8086”]
API token for authentication.
token = “$INFLUX_TOKEN”
Organization is the name of the organization you wish to write to; must exist.
organization = “ORGNAME”
Destination bucket to write into.
bucket = “BUCKETNAME”
The value of this tag will be used to determine the bucket. If this
tag is not set the ‘bucket’ option is used as the default.
bucket_tag = “”
If true, the bucket tag will not be added to the metric.
exclude_bucket_tag = false
Timeout for HTTP messages.
timeout = “5s”
Additional HTTP headers
http_headers = {“X-Special-Header” = “Special-Value”}
HTTP Proxy override, if unset values the standard proxy environment
variables are consulted to determine which proxy, if any, should be used.
http_proxy = “http://corporate.proxy:3128”
HTTP User-Agent
user_agent = “telegraf”
Content-Encoding for write request body, can be set to “gzip” to
compress body or “identity” to apply no encoding.
content_encoding = “gzip”
Enable or disable uint support for writing uints influxdb 2.0.
influx_uint_support = false
Optional TLS Config for use on HTTP connections.
tls_ca = “/etc/telegraf/ca.pem”
tls_cert = “/etc/telegraf/cert.pem”
tls_key = “/etc/telegraf/key.pem”
Use TLS but skip chain & host verification
insecure_skip_verify = false
[[inputs.internet_speed]]
This plugin downloads many MB of data each time it is run. As such
consider setting a higher interval for this plugin to reduce the
demand on your internet connection.
interval = “5m”
Sets if runs file download test
enable_file_download = false
Caches the closest server location
cache = false
When I run telegraf and try to view it with the InfluxDB user interface, there is nothing - no data at all. I ran telegraf with debugging on - no error messages, either.
My experience with each of T/I/G is that one can make fatal errors with any one of them, with no error messages and no diagnostics, just nothing to display in the end. It may be easier just to try to revert everything back to InfluxDB v1.
Please repost your config with proper code tag the three ticks ` before and after the whole config body.
No reason, you should redo a wholesale overhaul. This should be a simple migration
What is the data source telegraf is scrapping from?
I’ll restate a different way. What used to work was a package that used Ookla Speedtest via the command
/usr/local/bin/speedtest ---json
within a telegraf config file, with output sent to InfluxDB (v1). I then used Grafana to read from InfluxDB.
This is the original speedtest.conf that used to work:
[[inputs.exec]]
commands = ["/usr/bin/speedtest --json"]
name_override = "speedtest"
timeout = "1m"
interval = "5m"
data_format = "json"
json_string_fields = [ "interface_externalIp",
                       "server_name",
                       "server_location",
                       "server_host",
                       "server_ip",
                       "isp",
                       "name",
                       "result_url" ]
[[outputs.influxdb]]
  database = "telegraf"
  urls = [ "http://127.0.0.1:8086" ]
I have been unable to create any config file that produces any output to InfluxDB v2. I have tried creating a config file by hand (which is what I used to do) or with the Influx user interface, which essentially produces the same file.
There is also an InfluxDB v2 plugin called internet_speed. I tried using the sample configuration file for that, with equal null results (no data into the Influx database/bucket). With --debug enabled, I get a stream of lines like this:
2022-06-25T00:15:43Z D! [outputs.influxdb_v2] Buffer fullness: 0 / 10000 metrics
That is, no data.
There is an additional hurdle in that I then have to learn Flux in order to get the InfluxDB v2 data into Grafana. All my efforts on that front have failed as well.
The failed conf file for internet_speed follows. It is essentially a concatenation of sample outputs and inputs config modules.
 [[outputs.influxdb_v2]]
  ## The URLs of the InfluxDB cluster nodes.
  ##
  ## Multiple URLs can be specified for a single cluster, only ONE of the
  ## urls will be written to each interval.
  ##   ex: urls = ["https://us-west-2-1.aws.cloud2.influxdata.com"]
  urls = ["http://localhost:8086"]

  ## API token for authentication.
  token = "$INFLUX_TOKEN"

  ## Organization is the name of the organization you wish to write to; must exist.
  organization = "ORGNAME"

  ## Destination bucket to write into.
  bucket = "BUCKETNAME"

  ## The value of this tag will be used to determine the bucket.  If this
  ## tag is not set the 'bucket' option is used as the default.
  # bucket_tag = ""

  ## If true, the bucket tag will not be added to the metric.
  # exclude_bucket_tag = false

  ## Timeout for HTTP messages.
  # timeout = "5s"

  ## Additional HTTP headers
  # http_headers = {"X-Special-Header" = "Special-Value"}

  ## HTTP Proxy override, if unset values the standard proxy environment
  ## variables are consulted to determine which proxy, if any, should be used.
  # http_proxy = "http://corporate.proxy:3128"

  ## HTTP User-Agent
  # user_agent = "telegraf"

  ## Content-Encoding for write request body, can be set to "gzip" to
  ## compress body or "identity" to apply no encoding.
  # content_encoding = "gzip"

  ## Enable or disable uint support for writing uints influxdb 2.0.
  # influx_uint_support = false

  ## Optional TLS Config for use on HTTP connections.
  # tls_ca = "/etc/telegraf/ca.pem"
  # tls_cert = "/etc/telegraf/cert.pem"
  # tls_key = "/etc/telegraf/key.pem"
  ## Use TLS but skip chain & host verification
  # insecure_skip_verify = false

[[inputs.internet_speed]]
  ## This plugin downloads many MB of data each time it is run. As such
  ## consider setting a higher interval for this plugin to reduce the
  ## demand on your internet connection.
  interval = "5m"

  ## Sets if runs file download test
  # enable_file_download = false

  ## Caches the closest server location
  # cache = false
1 Like
What happens when you try running this manually
/usr/bin/speedtest --json
anyways this is working for me
[[inputs.exec]]
commands = ["c:/localbin/speedtest -f json"]
name_override = "speedtest"
timeout = "1m"
interval = "5m"
data_format = "json"
json_string_fields = [ "interface_externalIp",
                       "server_name",
                       "server_location",
                       "server_host",
                       "server_ip",
                       "isp",
                       "name",
                       "result_url" ]

# Configuration for sending metrics to InfluxDB 2.0
[[outputs.influxdb_v2]]
  ## The URLs of the InfluxDB cluster nodes.
  ##
  ## Multiple URLs can be specified for a single cluster, only ONE of the
  ## urls will be written to each interval.
  ##   ex: urls = ["https://us-west-2-1.aws.cloud2.influxdata.com"]
  urls = ["http://127.0.0.1:8086"]

  ## Token for authentication.
  token = ""

  ## Organization is the name of the organization you wish to write to.
  organization = "xxx"

  ## Destination bucket to write into.
  bucket = "speedtest"

  ## The value of this tag will be used to determine the bucket.  If this
  ## tag is not set the 'bucket' option is used as the default.
  # bucket_tag = ""
You probably need a clean _measurement name instead of speedtest.
I can get speedtest to run standalone at a Linux command prompt.
I can get a TIG stack to work with InfluxDB1 and associated telegraf and grafana modules. It’s been running for a couple of years.
I cannot get the config file quoted above to give me any output with InfluxDB2. I made a new bucket speedtest2, and did an override of speedtest2. I then ran telegraf on the config file with --debug option. The output said that it had written a batch of 1 metric every 5 minutes, but I can’t find any sign of it.
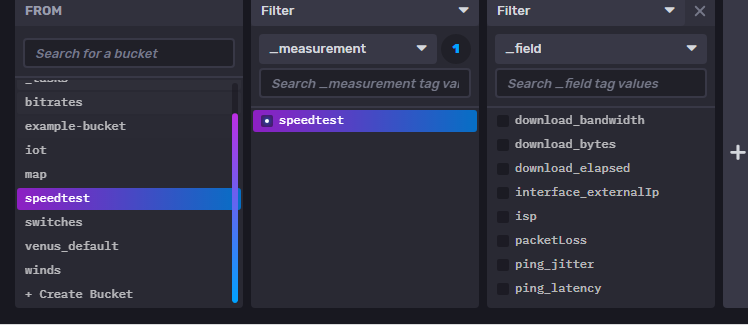
If I look at the data explorer window of the Influx interface, under bucket speedtest2, there is no “_measurement” string above the filter window, nor anything else, as per the screen shot.

Is it still running? Saw the same thing. When I stopped it, it said something about flushing it