- What Grafana version and what operating system are you using?
I am currently using grafana 8.5.4 and mac os 12.4
-
What are you trying to achieve?
I am trying to save a custom PromQL query as a template variable which i can use in multiple panel dashboards.
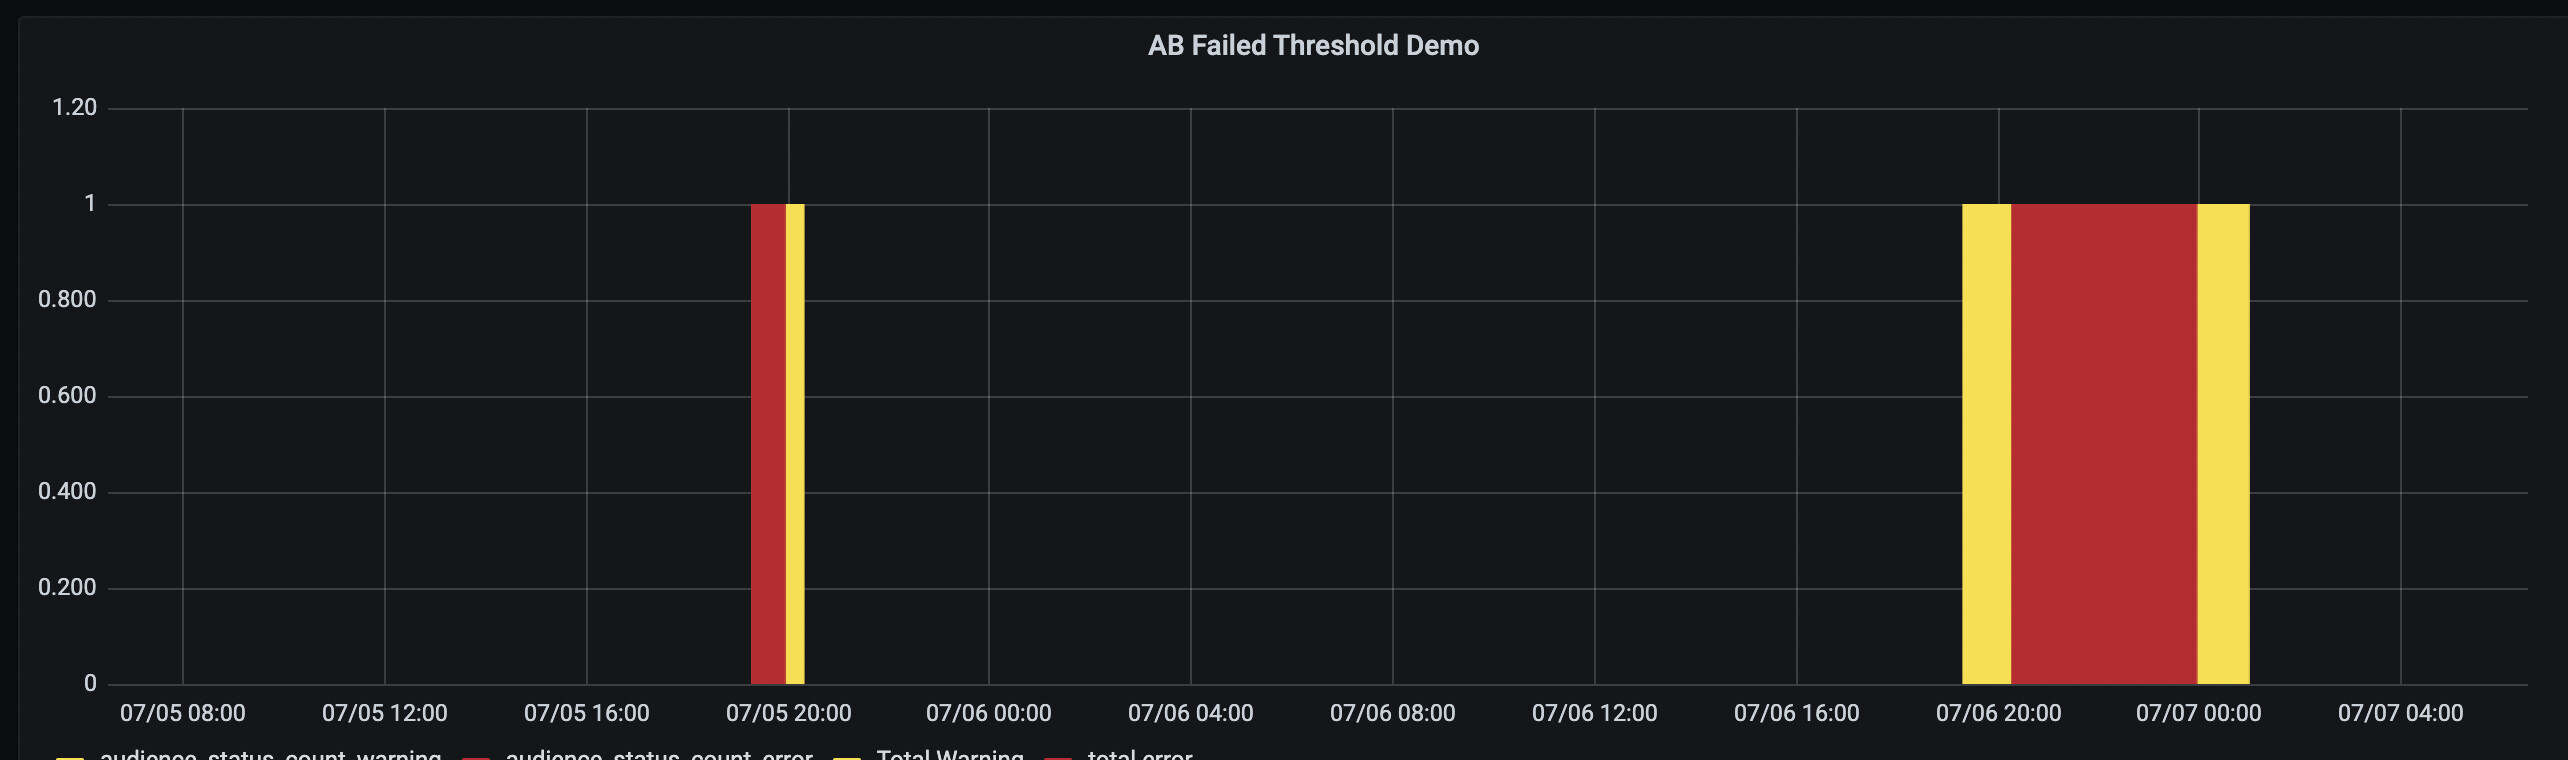
I want to plot a overall health dashboard for my systems. If a value in a panel goes beyond warning threshold but below error threshold then I am plotting it as 1 (or in yellow color) if it goes beyond error threshold then i am plotting as 2(or red color) in another panel.
I have a separate result panel which tracks threshold breach in 3 different panels.
-
How are you trying to achieve it?
I am planning to use following queries
warning - (vector(1) and on() (25 <metrics_size >0)) or on() vector(0)
error - (vector(2) and on() (metrics_size <0)) or on() vector(0)
I have to create 6 different queries (2 for each panel) for result panel.
Can we store this as template query? where i can just change threshold values and metrics name?
If yes how to achieve that. I really appreciate if you suggest any alternate feasible solution for this problem.
Can we store this as template query? where i can just change threshold values and metrics name?
this is not super clear to me. can you try and illustrate or screenshot what you are trying to achieve?
I am trying to plot health monitoring metrics using grafana.
I am monitoring multiple panels in grafana. Each of these panels has 2 threshold values
a. warning b. error
In my result health panel I am plotting only if metric value is greater than threshold but less than error then it should mark it as 1 and yellow color.
I am having prometheus as backend db.
so my warning query is
vector(1) and on() (500 < metrics_count{status=~“xyz”} < 1000 ) or on() vector(0)
similarly my error query is
vector(1) and on() (metrics_count{status=~“xyz”} > 1000 ) or on() vector(0)
My question can i save this query as template variable.
whenever i use another template variable inside variable and if variable is constant it is giving an error.
Is it possible to do so.
The purpose behind this is I can save query, variable, threshold variables and use it
vector(1) and on() $warning <$AB <$error or on() vector(0)
I will have 2 queries for each panel(warning and error) if i have multiple panels e.g. 10 different panels then i have to write 20 queries in similar way. Adding query as template variable will avoid repetation
Thanks in advance.