-
What Grafana version and what operating system are you using?
Rocky Linux 9, grafana-10.1.4-1.x86_64 -
What are you trying to achieve?
It is hard for me to understand the basic concept behind variables (I guess).
I have a prometheus datasource with several jobs monitoring website endpoints.
I would like to automatically create panels on a grafana dashboards (one panel for each monitored site) via “repeat”. -
How are you trying to achieve it?
So I created a query variable on a grafana dashboard which contains all instance names:

I see the required values on the bottom of this page:
So I try to use this variable now to create a dashboard panel in the filter. You can see the variable contains the desired value in the panel name:
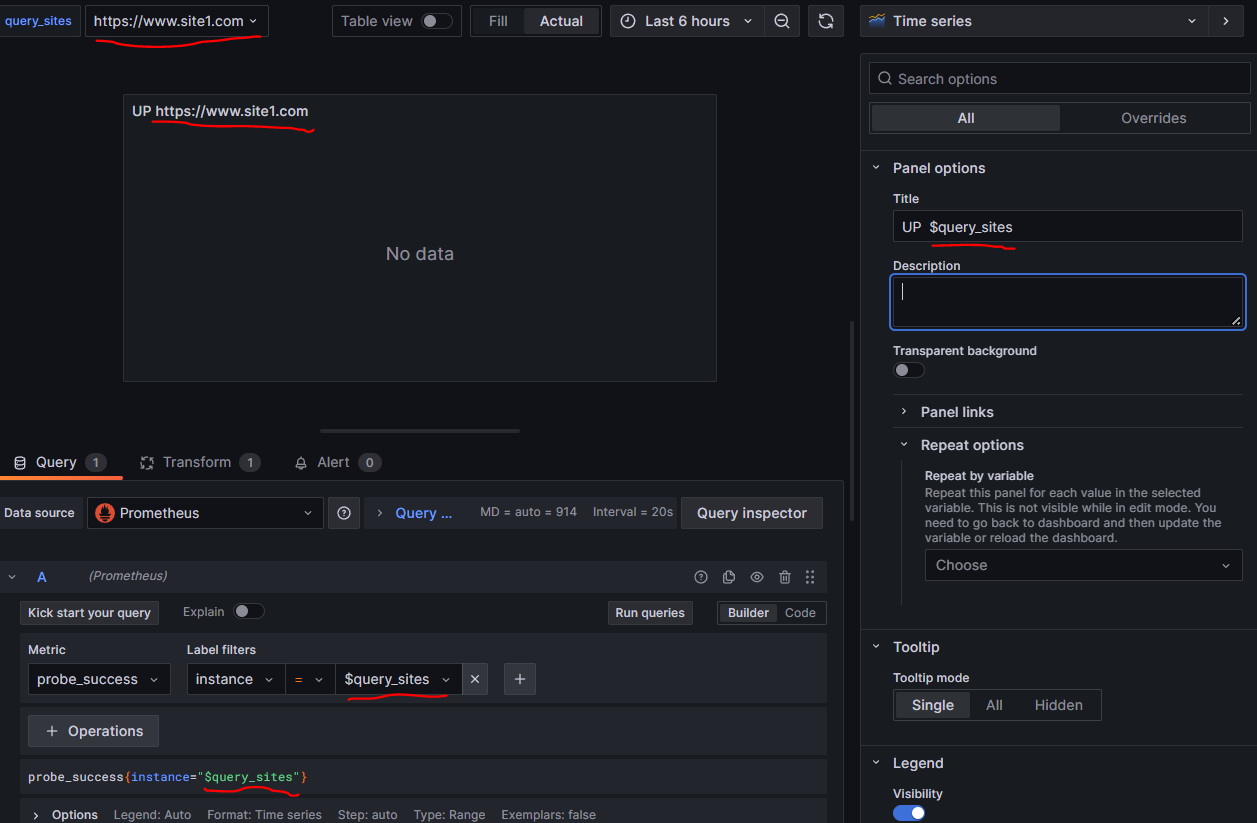
But it says “No data”.
If I put the name to the filter statically, it gets the data:
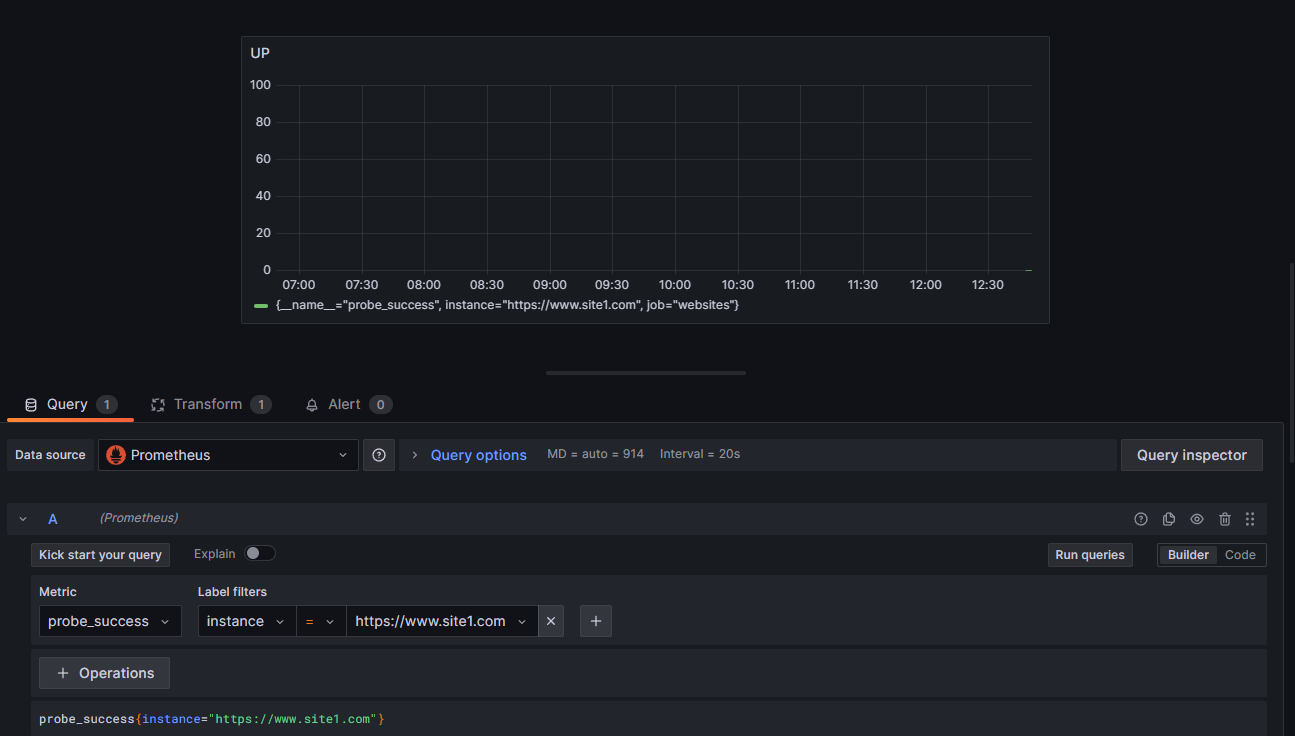
But I want to use the variable in order to be able to dynamically use the dashboards / repeat panels.
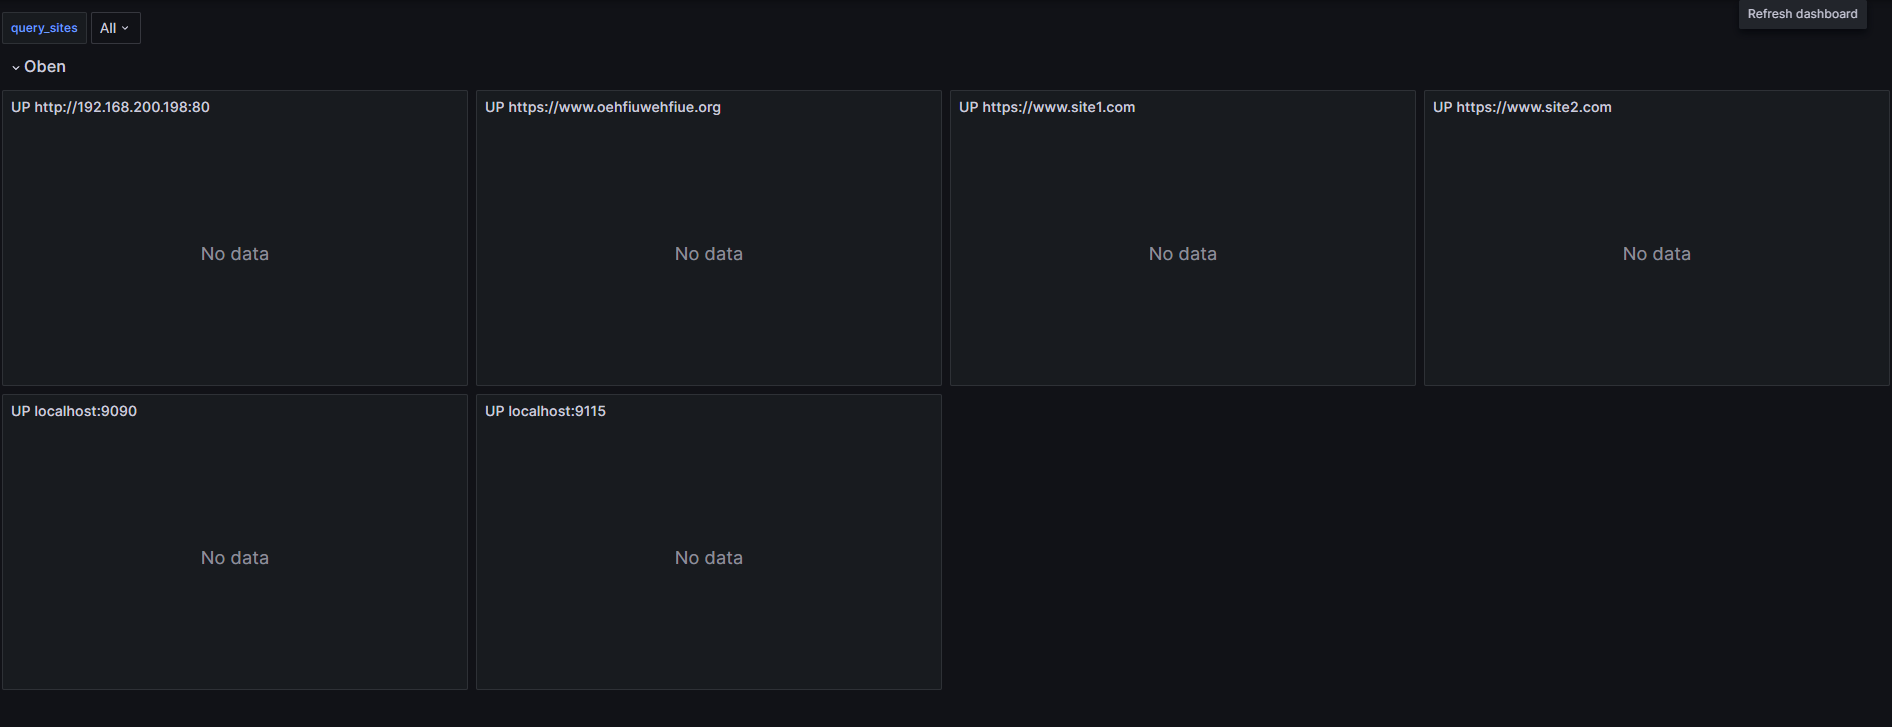
I just discovered it works when disabling the multi value or all option in the variable settings. But I would like to be able to choose more than one variable at once to repeat the panel automatically. The repetition works as expected, but as said without data:
What am I doing wrong? How can I achieve my goal?
I am aware this must be a pretty basic question and I really tried to solve it myself via documentation, reading tutorials, and so on …
