- Grafana 10.0.3
I have a time series line graph in which I want to show max and average cpu usage per node. I would like the average usage per node to show with solid lines, and max usage per node to show with dashed lines. Between the two “sets” of data, I’d like the colors to match on the node name.
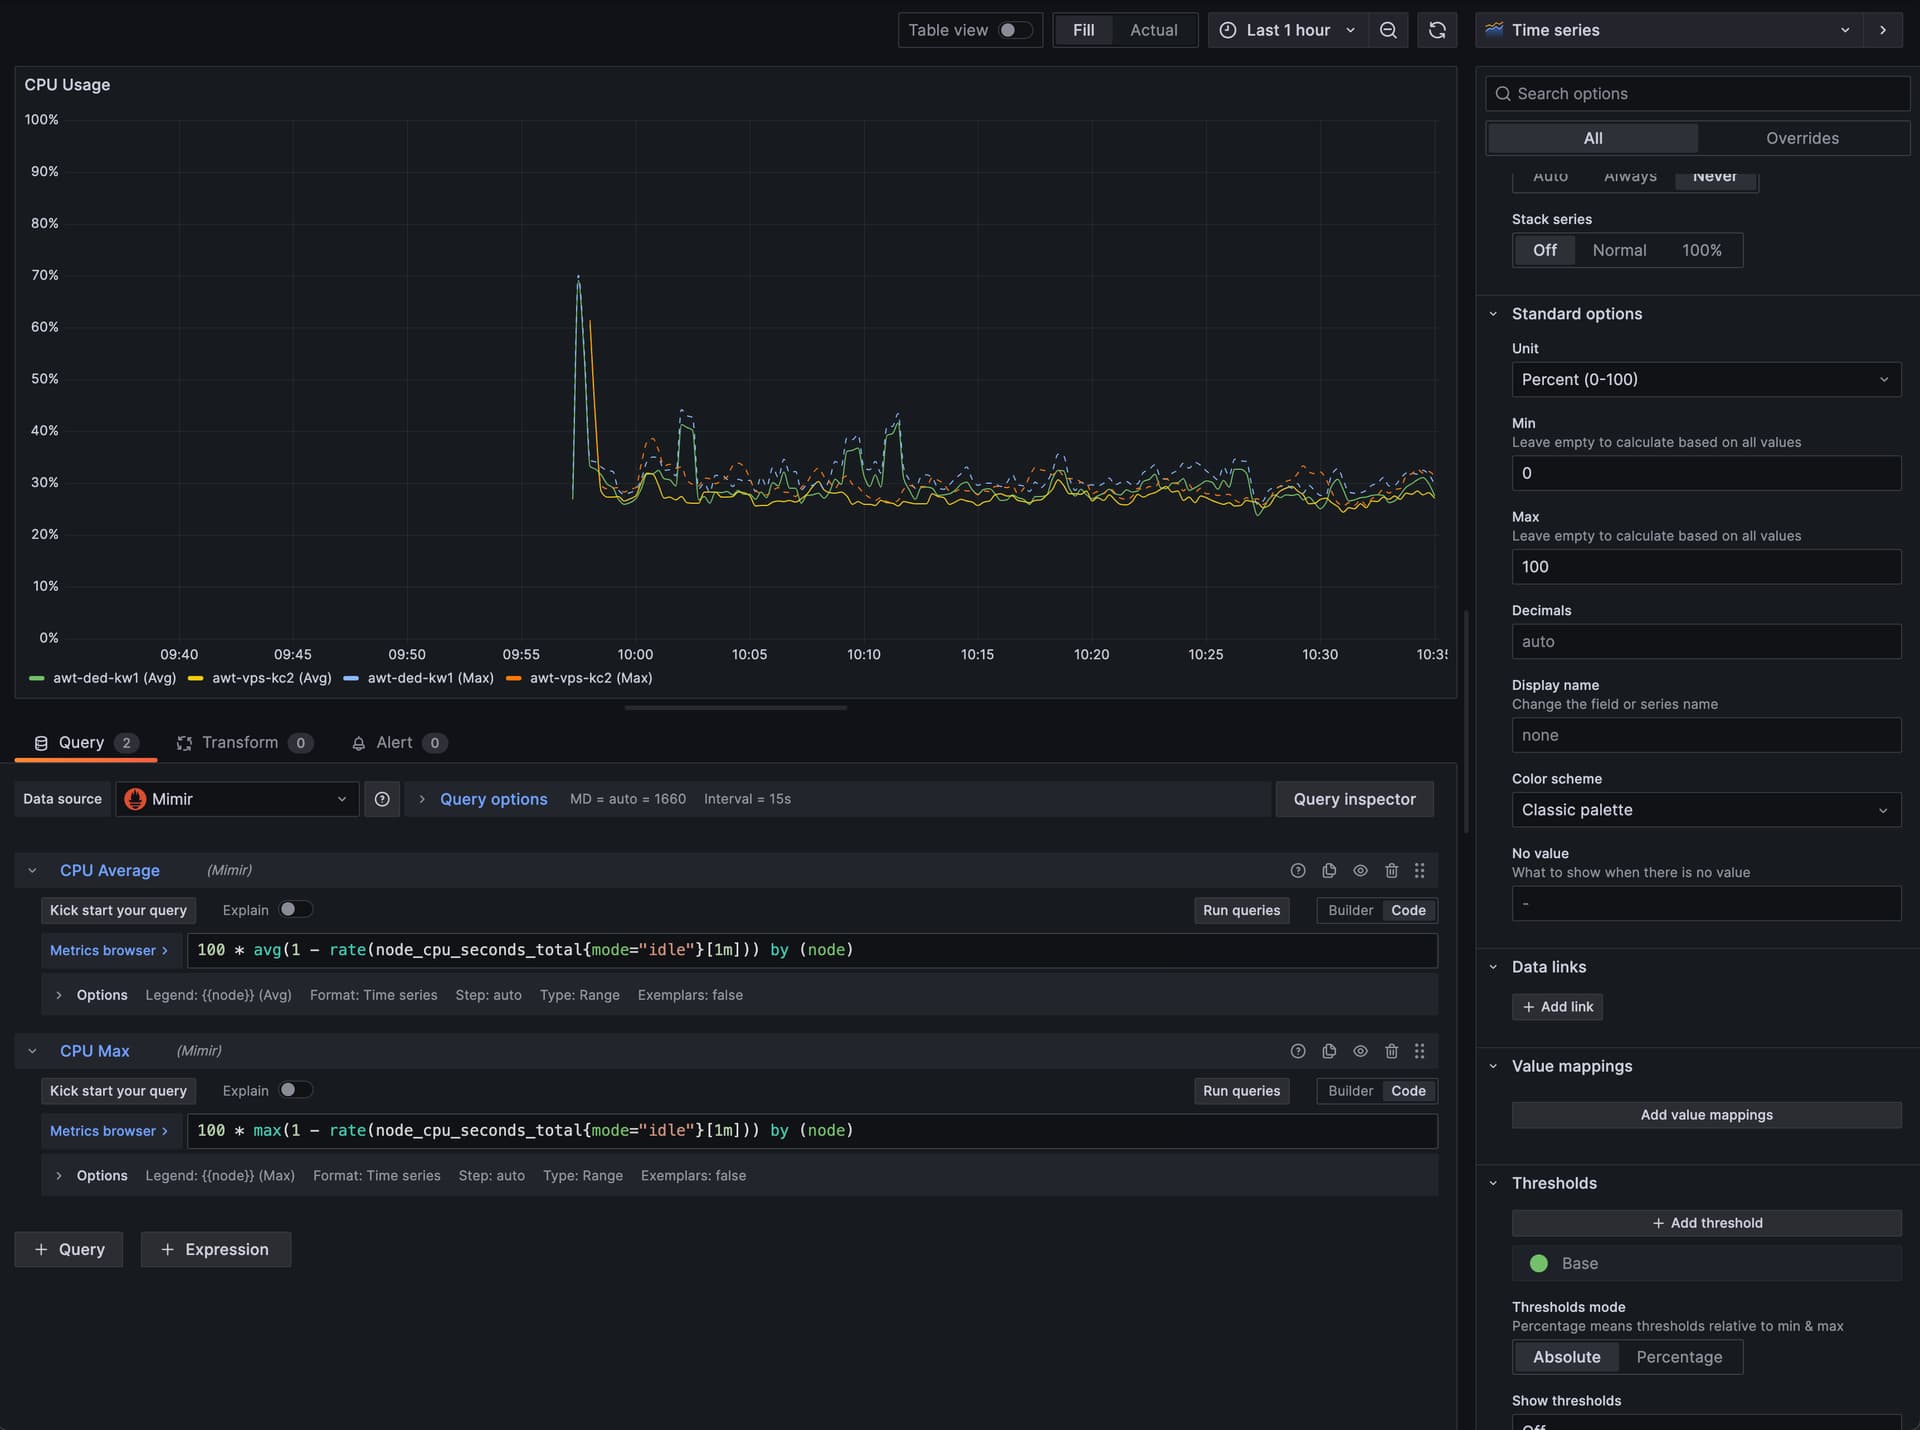
The average and max lines are achieved using a query for each, and so I’ve been able to add an override by query to get the average in solid, and max in dashed. However, as can be seen below, the color is unique across all series, amounting to 4 colors in total. How can I configure the graph to show the average and max lines, per node, to be the same color (i.e., awt-ded-kw1 in green, and awt-vps-kc2 in yellow)?