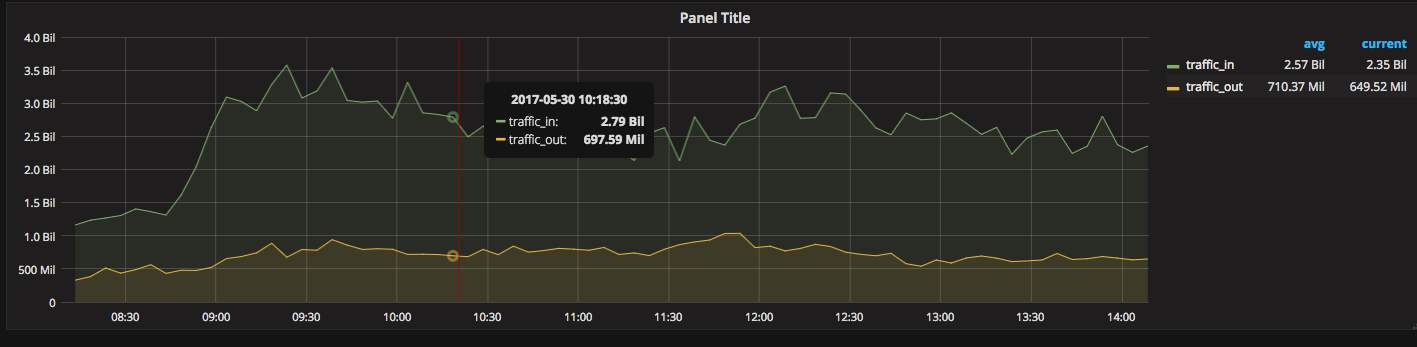
i have been monitoring the router traffic in centreon monitoring system and grafana. I noticed that centreon graph is accurate but in grafana i dont see the exact graph which means “current and avg value is wrong” the correct value is 255.4M , but in grafana i see as 2.35gbps. How to show the accurate value in grafana?
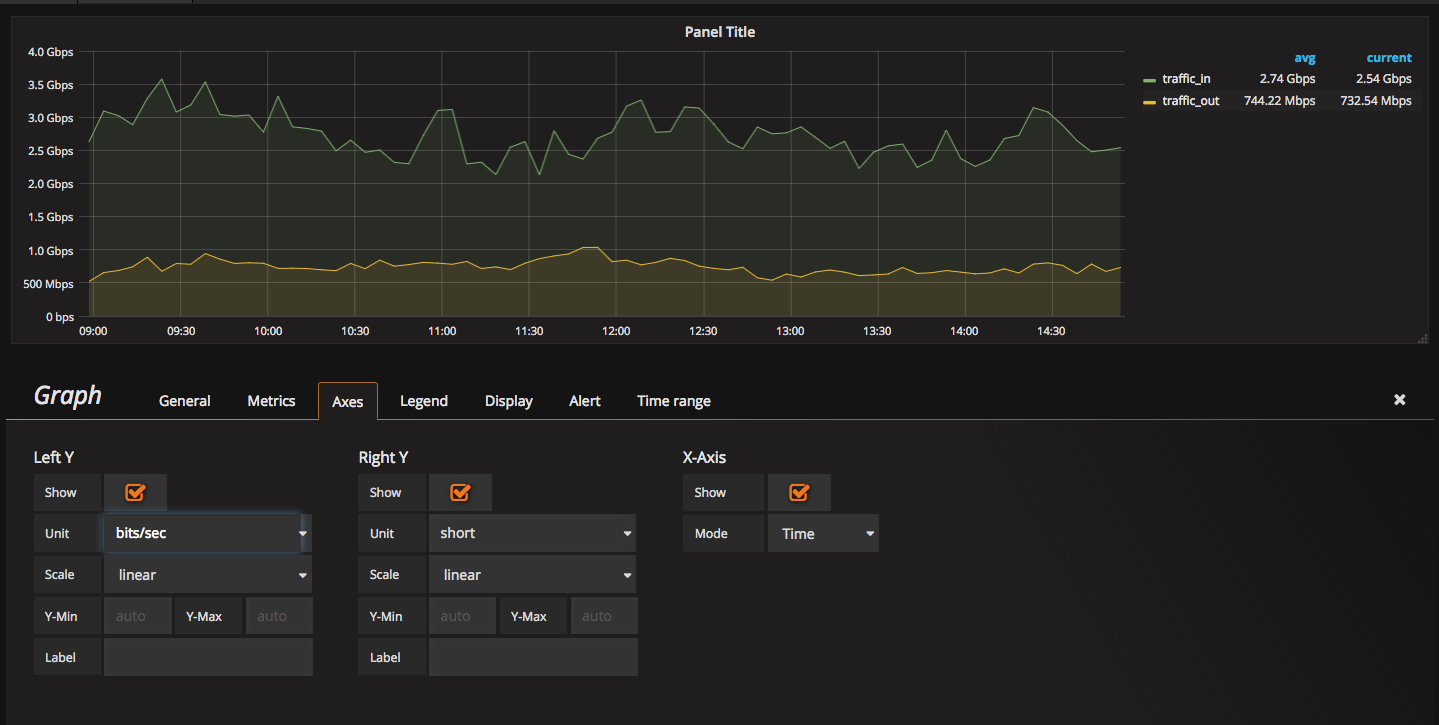
Which bytes per second unit did you choose? There are two: Data(IEC) and Data(Metric). If you chose Data(IEC) then it is not megabit/s - it is mebibyte/s.
Thanks for your time. i am using the unit -> . data rate -> bits/sec
Actually grafana is working fine. The reason why i see the different value in centreon and grafana is that. The script execution time is different. But i am using the same script in both sides to collect metrics. i compare the value in grafana against with script value, its same. Hence i assumed that value is correct in grafana.