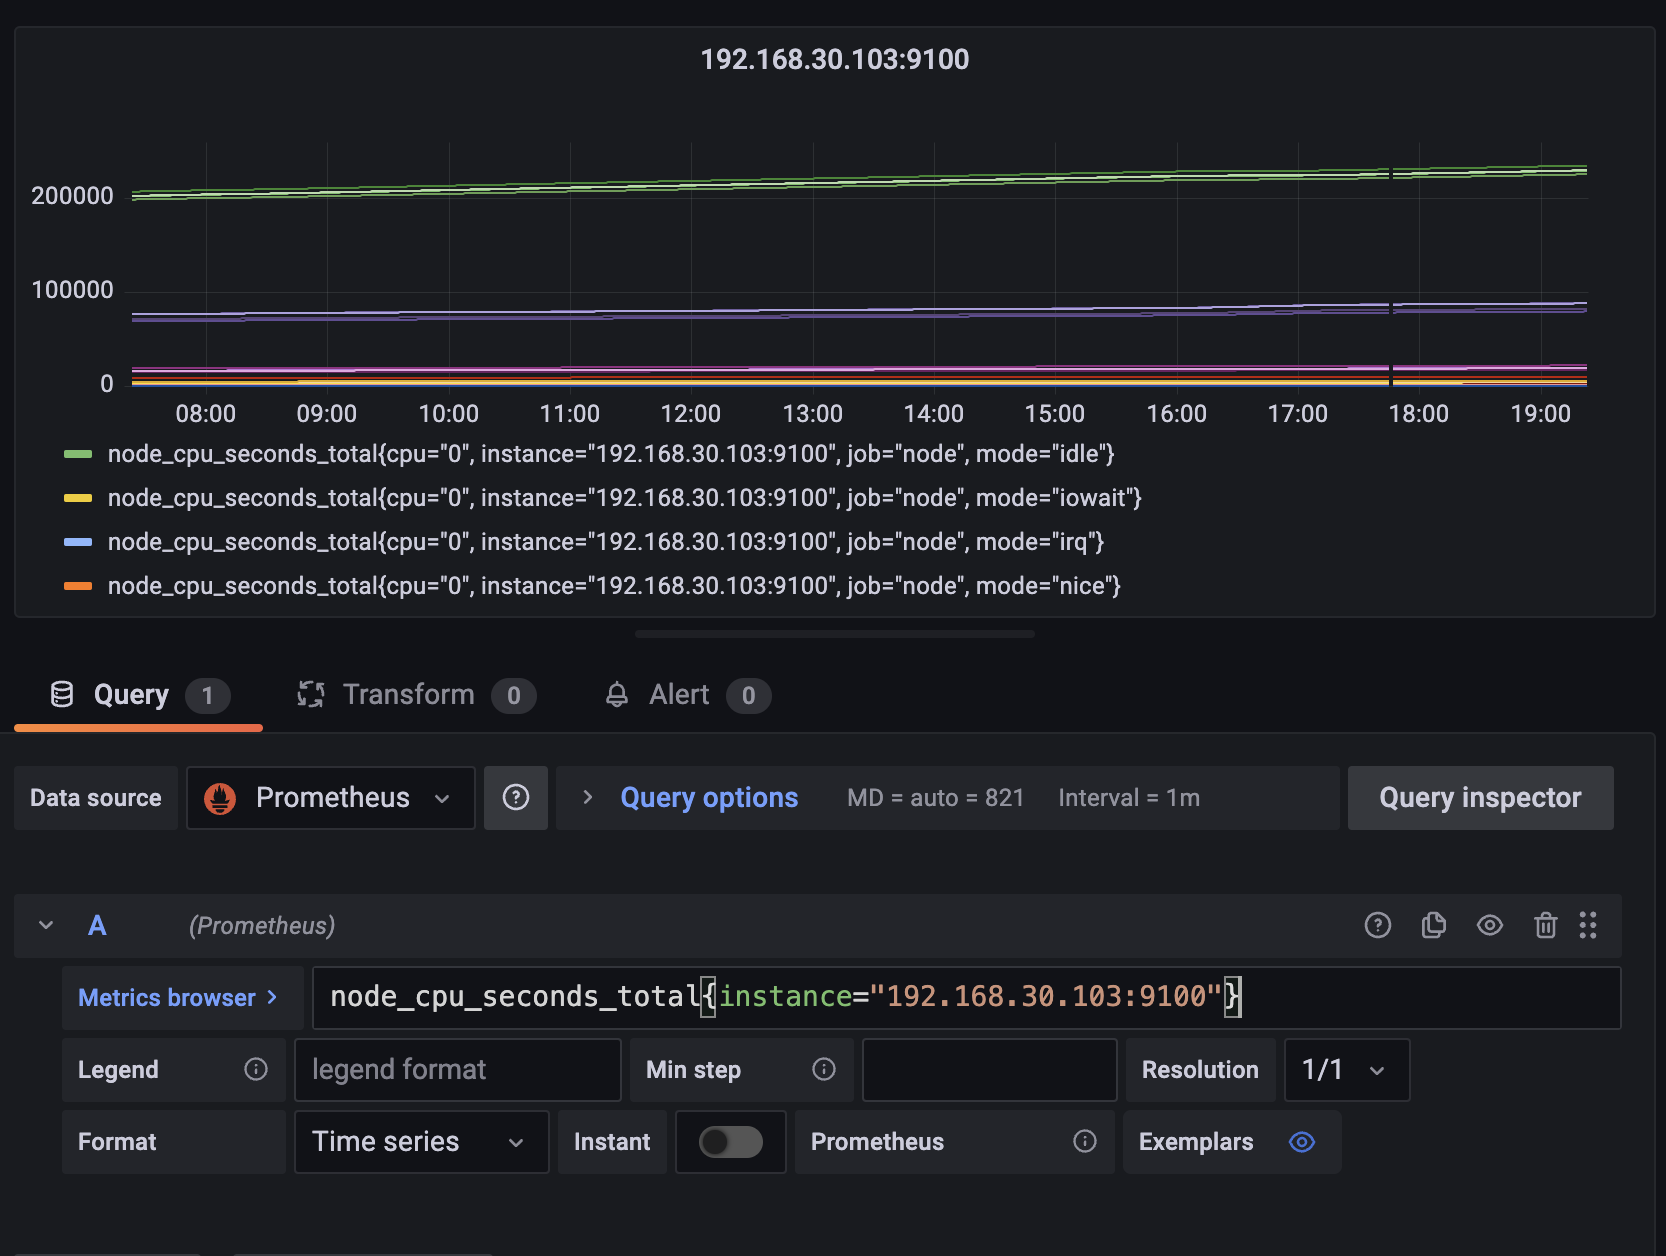
If I replace node_cpu_seconds_total{instance="${node}"} with node_cpu_seconds_total{instance="192.168.30.103:9100"}, then the query works, so I’m not sure why it isn’t picking up the desired result when using ${node}.
This thread is marked as solved, but it isn’t really. I found the explanation and the correct solution behind this problem.
Root cause: repeating variables are escaped by Grafana.
For example, if your query contains an IP address, it will be sent by Grafana as 127\.0\.1\.1 instead of 127.0.0.1. Thus, the workaround =~ works because you query is being interpreted as a regex certainly.
Yes, it’s a strange default behaviour and that’s why we are here now. Digging it in deeper, I discovered that glob formatter is being applied during variable interpolation as fallback method (Why? I don’t know). See [1] and [2] for more information.
So, how can we solve this without using regex operator =~?
The answer is to explicitly use raw variable interpolation syntax. Using as example the query in the first post, we have to rewrite the query like this:
wmi_system_threads{instance="${server:raw}")
Henceforth, my recommendation is always using explicit raw variable interpolation syntax for your repeating queries.