What Grafana version and what operating system are you using?
9.3.2 on a raspberry pi 4 with Flux language.
What are you trying to achieve?
Show the energy consumption of the last 7 days.
What happened?
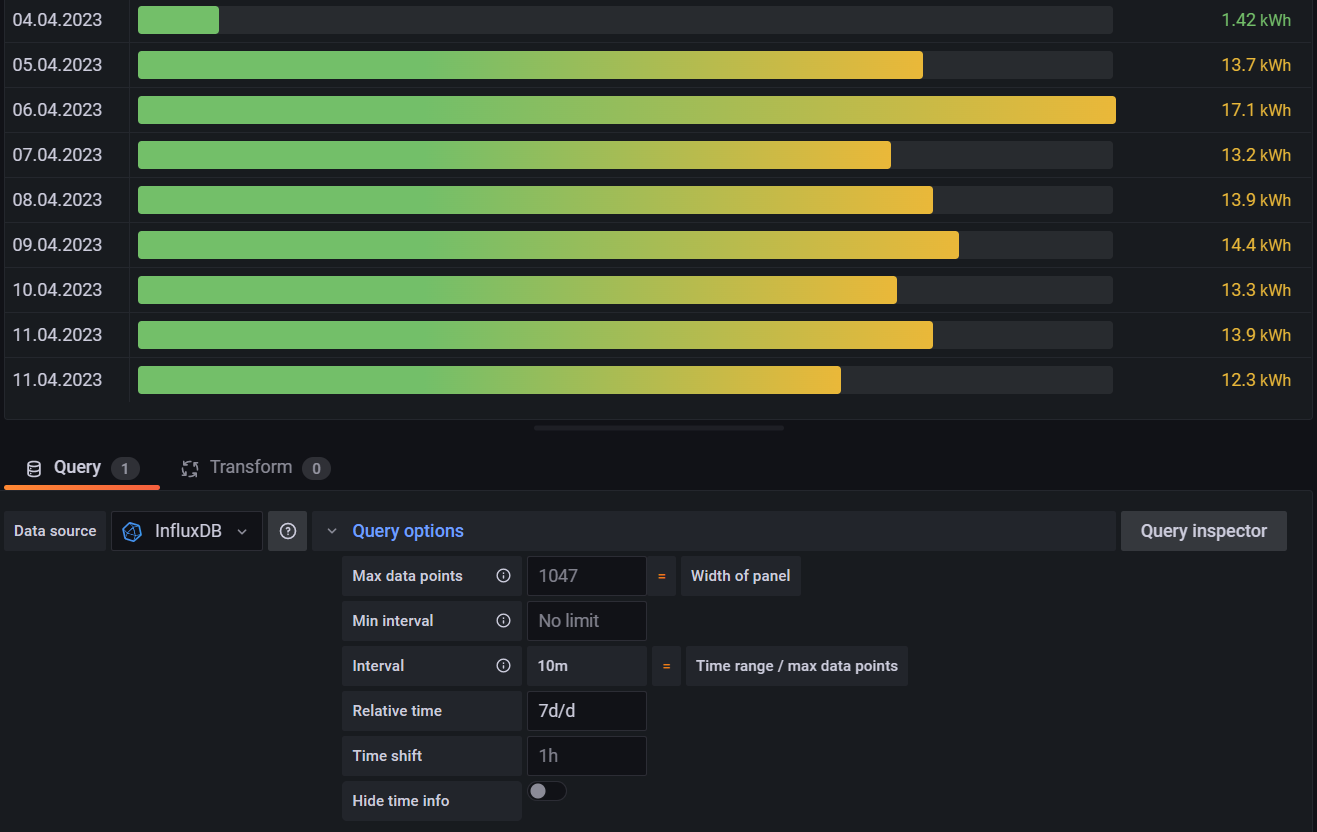
I configure the panel as the following.
But it shows me always 8 days (the last day two times)
I think it starts always 7 days back from now.
What did you expect to happen?
I want to start with the last 7 days start with today and show only complete days.
That means today and the last 6 days and nothing more.
I hope I explained my problem as good as possible. Please let me know I you need more informations.
I believe that if you are using any of these nodes and are not specifying the timestamp, then as you read the modbus data and send to InfluxDB, the timestamp will be in UTC. This is what I use and all my timestamps are stored in UTC.
Have you gone to InfluxDB directly (http://your-ip-address:8086) and looked at a table of your data to inspect what time is being used? See last column in the screenshot below.
The time in my InfluxDB Data Explorer looks like UTC time. In Germany we have at the moment UTC+2 and the time stamp is 2 hours earlier then the actual time.
In the csv export from InfluxDB I see every second a new value. Strange is that I read every 3 seconds the modbus interface and the config on InfluxDB node for Time Precision is set to Seconds (s). In the csv export there is for every second a new value. For sure changed only a little bit but it is changed.
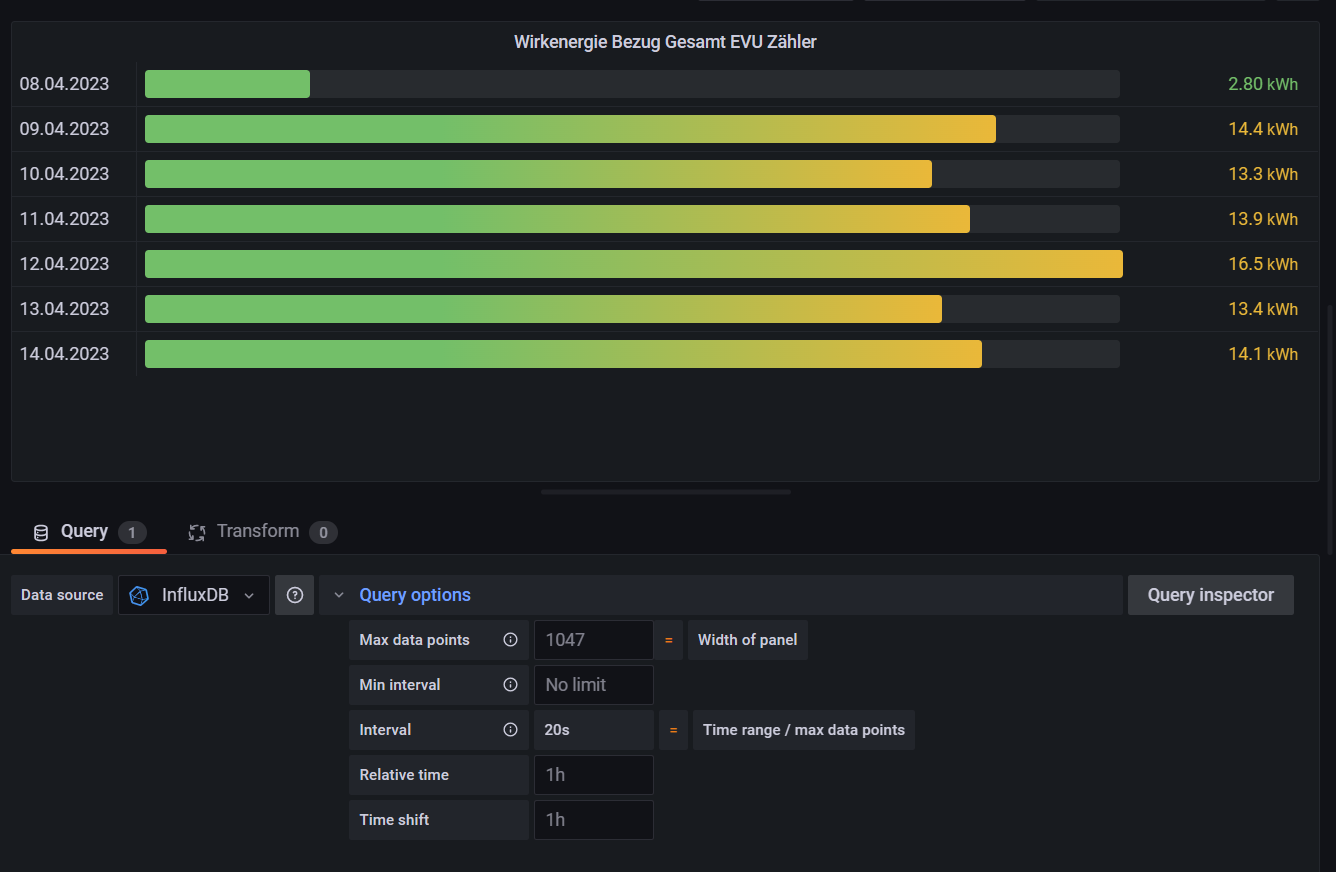
That is the best solution until now. The only problem i have is that it looks like the first day in the table is only shown only with the data from the time right now until midnight. This screenshot is from today around 9:30 pm. The energy on this day is about 14 kWh.
I have one table that is nearly what I want.
The problems are that I use the unit 1w to see the last 7 days. In this case is shows me only 3 days. If I change it to 1 mo for the last month it is working normaly. Also the performance is very slow with this query.