At first I thought it might be due to some api taking forever, but that it also not the case. I checked query inspector and I could see all queries and their data frames response
@yesoreyeram Let me know if you got any clue, could this be an infinity plugin issue ? I have also tried upgrading the plugin to latest version but it is still the same.
@adityavermamanit - Try different things such removing all the transformations (not just hiding), create a query from scratch on a new dashboard or click the error message in the brower console to see where your error is originating. It is very hard for anyone to tell what’s going on with your API response.
If nothing helpful, post the response from your api and the dashboard json for others to reproduce the issue.
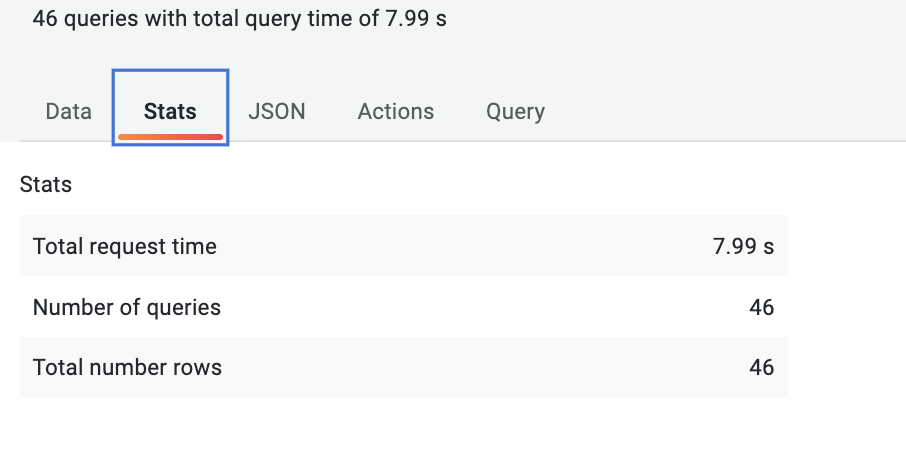
There are 46 queries, so adding them one by one to another dashboard is really tedious, but what I have done is make sure each query is returning response after transformation.
If you go to Data panel of query inspector, you can choose one query at a time, apply or remove transformations → for each query I have made sure there is a result after transformation in each case.
I think it must be an environmental issue. In the past you have posted similar issues with queries taking unusually long time. I would chuck this to something in your environment and not grafana nor infinity plugin.
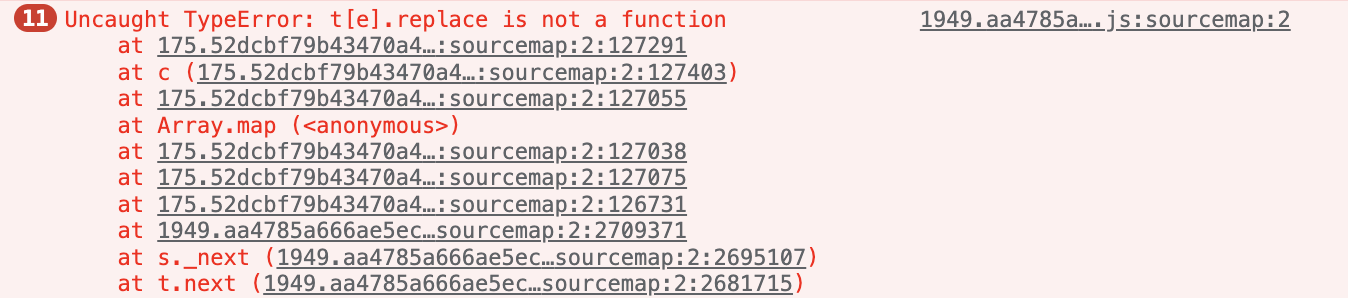
I am using Grafana Cloud, so changing the browser would change the environment I guess, but it is a cloud instance so independent of my local environment, I don’t think its environment related, you can see error stack trace in console output which appears for this panel only and not other panels