Prometheus: yearly usage, that can display 1 bar showing monthly total usage

  • I am using Grafana v12.2.0

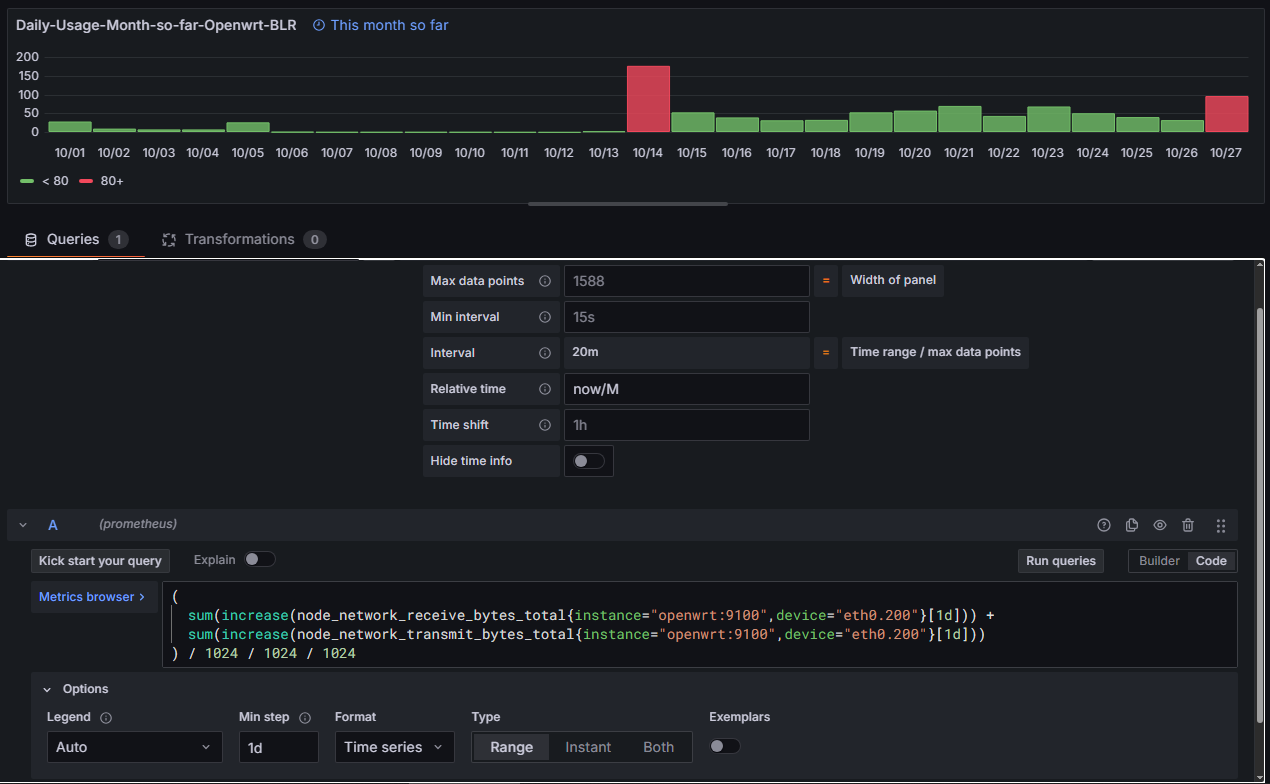
  • I already have visualization bar char that shows daily today usage of month. Where 1 bar that shows total usage of a day.

  • {
          "datasource": {
            "type": "prometheus",
            "uid": "deb1h68j00a9sf"
          },
          "fieldConfig": {
            "defaults": {
              "color": {
                "mode": "thresholds"
              },
              "custom": {
                "axisBorderShow": false,
                "axisCenteredZero": false,
                "axisColorMode": "text",
                "axisLabel": "",
                "axisPlacement": "auto",
                "fillOpacity": 80,
                "gradientMode": "none",
                "hideFrom": {
                  "legend": false,
                  "tooltip": false,
                  "viz": false
                },
                "lineWidth": 1,
                "scaleDistribution": {
                  "type": "linear"
                },
                "thresholdsStyle": {
                  "mode": "off"
                }
              },
              "mappings": [],
              "thresholds": {
                "mode": "absolute",
                "steps": [
                  {
                    "color": "green",
                    "value": 0
                  },
                  {
                    "color": "red",
                    "value": 80
                  }
                ]
              }
            },
            "overrides": []
          },
          "gridPos": {
            "h": 8,
            "w": 24,
            "x": 0,
            "y": 4
          },
          "id": 5,
          "options": {
            "barRadius": 0,
            "barWidth": 0.97,
            "fullHighlight": false,
            "groupWidth": 0.7,
            "legend": {
              "calcs": [],
              "displayMode": "list",
              "placement": "bottom",
              "showLegend": true
            },
            "orientation": "auto",
            "showValue": "auto",
            "stacking": "none",
            "tooltip": {
              "hideZeros": false,
              "mode": "single",
              "sort": "none"
            },
            "xTickLabelRotation": 0,
            "xTickLabelSpacing": 0
          },
          "pluginVersion": "12.2.0",
          "targets": [
            {
              "editorMode": "code",
              "expr": "(\r\n  sum(increase(node_network_receive_bytes_total{instance=\"openwrt:9100\",device=\"eth0.200\"}[1d])) +\r\n  sum(increase(node_network_transmit_bytes_total{instance=\"openwrt:9100\",device=\"eth0.200\"}[1d]))\r\n) / 1024 / 1024 / 1024",
              "interval": "1d",
              "legendFormat": "__auto",
              "range": true,
              "refId": "A"
            }
          ],
          "timeFrom": "now/M",
          "title": "Daily-Usage-Month-so-far-Openwrt-BLR",
          "type": "barchart"
        }
    

Can some one please help me now create another visualization to show yearly usage, that can display 1 bar showing 1 month’s total usage.

Still trying to get this done. Any help would be appreciated.

Can you see if the new sql expression feature can do it for you?

Are you able to give me any example or documentation to read through?

Can you please share what the data looks like in table view

Docu

query,

(
sum(increase(node_network_receive_bytes_total{instance="openwrt:9100",device="eth0.200"}[1d])) +  sum(increase(node_network_transmit_bytes_total{instance="openwrt:9100",device="eth0.200"}[1d]))
) / 1024 / 1024 / 1024

original question was in regards to a bar chart but now we are seeing a time series. time series requires time :slight_smile: but you want to show things per month.

Sorry I did not understand.
With below I can get bar chart for monthly usage (I column per day usage)

All I want is similar for yearly usage (that is, one column per month data usage)

Maybe a query like

Select year(yourdatetime) as _year, count(1) flimflam

From boomshaka

Group by year(yourdatetime)

Or

Select month(yourdatetime) as _month, count(1) flimflam

From boomshaka

Group by month(yourdatetime)

Something like above. You will need to look at year() function documentation for mysql