I am using Grafana to plot temperature data.
The temperature sensor is connected to Home-Assistant, then Prometheus scrapes that data, and Grafana plots from Prometheus.
The sensor updates its temperature values only when a new temperature is recorded.
Prometheus scrapes the data every 60s, so there are lots of timestamps where the same temperatures are recorded. The temporal accuracy of that time series is just wrong.
When I plot the temperature with Grafana, the Data looks not very smooth.
It looks like there are huge changes in temperature after a long time of no change in temperature. Is there an option to only plot the most recent data point with a different value than the points before. Or do I have to edit my Prometheus data first? I cannot just apply a 5 min or 1h average filter, because the changes in temperature can happen for everything between 1 min to 10h.
I just want Grafana to make a line plots between the unique points in Time, to make the temperature curve look much smoother than the blocky graph I have now.
So based on how you’re scraping your data and how your temperature sensor works, it sounds like you’re getting the right data into the chart. But the reason you’re probably seeing this “stair stepping” is because of the line interpolation setting. Take a look at these two screenshots, and you should be able to see the little button to the right under “Line Interpolation”. Try that and you should get a smoother curve instead of the stair stepping.
As I have so many data dots, Grafana cannot make smooth lines between the dots, which contain the actual changes in temperature.
I also tried to adjust the query min interval to be something like 1h, but then faster changes in temperature are not shown.
Honestly I’m not sure where to go with this one. It seems the data is being sampled fine, and also charted appropriately, but the issue more is the way your sensor is delivering data, is that right?
I.e. your sensor looks like it’s registering 23.5, and then 23.7C, but never 23.6C, so it can’t be a smooth line no matter what, if the sensor doesn’t ever report the intermediate value.
Your Y axis is a little “zoomed in”. At this resolution of Y axis, the only way you’d get a smooth line is if your temperature sensor was reporting hundredths of a degree, and then you’d probably see a smoother line ascending from 23.6 → 23.7.
As such I’m not sure what you can really do here other than get a better sensor or change your view options? While it’s possible to do things like use Transforms in Grafana to change the value of individual observations, the trouble with doing that here is you don’t necessarily know what the value should be at any particular point. That’s the sensor’s job.
The problem, in my opinion, is the data sampling itself. I don’t think it is fine.
I do not want the duplicate data values of the sensor at the scrape rate, at which Prometheus is scraping from my Home-Asssistant.
I would prefer to have the Data pushed to Prometheus, at the actual rate the sensor is recording the temperature. But because this rate is depending on how fast the temperature is changing, I cannot set up a good scraper with Prometheus.
If there are only Data-Points with actual differences in Temperature in Prometheus, Grafana would draw a smooth line between 23.5C and 23.7C.
(No need for a measurement at 23.6C, if there are no other values between 23.5C and 23.7C.)
So maybe I could draw the line only at points at which Grafana is detecting a change in the values?
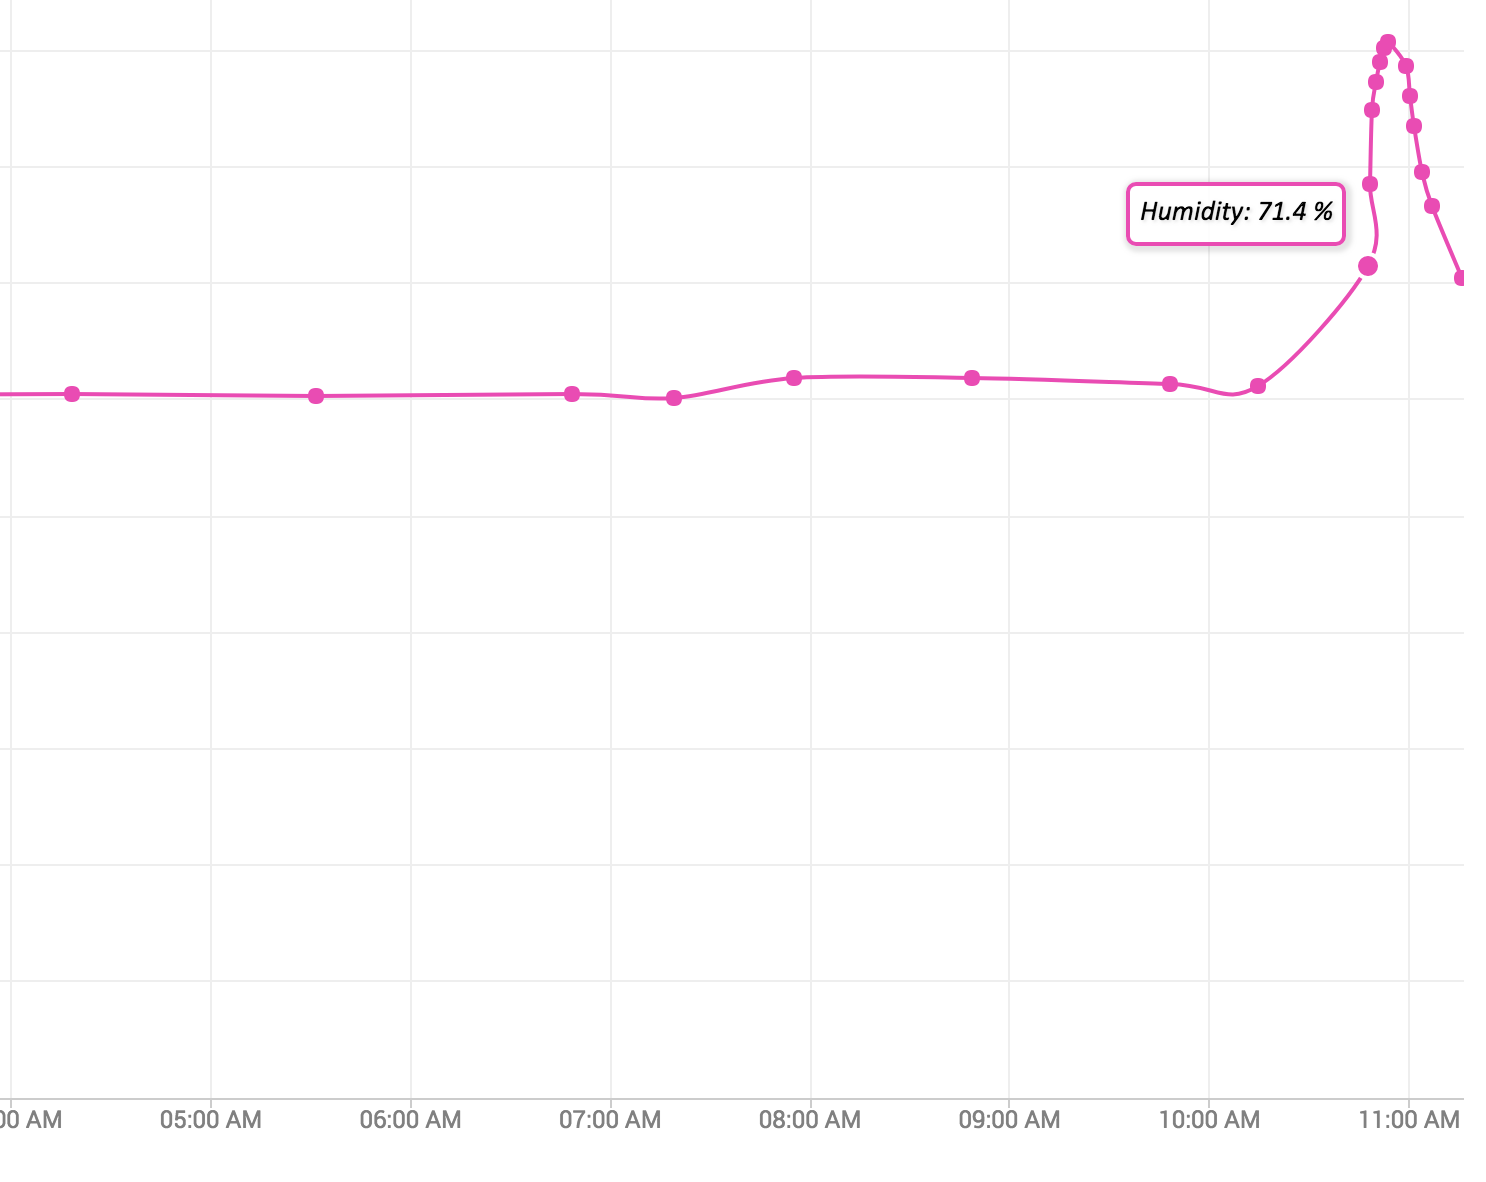
My final plot should look like the one here. With better resolution for areas with more changes in temperature. Only connecting dots which are actually a change in temperature.
My sensor just records a new value if the Temperature difference is high enough, yes.
Normally, at steps of 0.2 degrees or more. The recording rate then only depends on how fast the temperature is changing.
But Prometheus is filling the nonexistent temperature values at my scrape rate of 60s from Home-Assistant, which always supplies the last valid measurement to Prometheus.
Sorry for not being direct enough.
The sensor did not record for 23.6°C.
(26.x°C is not visible in this plot, so I guess that is what you are referring to?)
The gaps are being filled by Prometheus,
but I want Grafana to draw a straight line between the actual measurements.
(An actual measurement being when the value of the data changes)
I cannot really change the scrape itself (as I explained above). Maybe there is a better option, but I am not aware of any.
And I think pushing the data to Prometheus (which would fix the fake measurements) would be too complicated to set up.
So I hope there is some kind of query which filters the data down to the points I am interested in.
Prometheus pulls the data from my Home-Assistant at a fixed rate of 60s
If I find a method to push data to Prometheus instead, whenever the sensor updates the temperature, that would solve my issue with filler data points.
The filler data points are identical until a new reading comes in.
Please have a look the second Plot I have uploaded. (The one with the visible dots). I think it is very easy to see there how the fake data looks like.
This is the plot for all the sensors in my flat.
The red one is outside, the yellow one exposed to the sun during the afternoon.
So, there is not really any pattern, other than depending on the speed of the temperature change.
Which itself is influenced by weather, heating or sensors location.
All of this would look absolutely smooth and not blocky, if I can just get rid of the fake data points.
I solved my problem.
I switched to InfluxDB to push my sensor data from Home-Assistant.
Here, the recordings are stored at the correct timestamp, with no scrape-data in-between.
This is a much better setup for my use case.
This is a “push vs pull” situation. Prometheus pulls metrics, if your sensor doesn’t change, then you always have the same value. Influx is push-based, so you have a datapoint only on changes.
Graphics are smooth with Influx, operations are straightforward with Prometheus (you don’t need to linearly fill intervals to get a mean value for example).