Hi,
I’m instrumenting network telemetry data with Prometheus and representing the data in Grafana.
For certain metrics labels, the data shown in Prometheus is not consistent with Grafana dashboard. After verification, the data displayed from the Prometheus graph is correct.
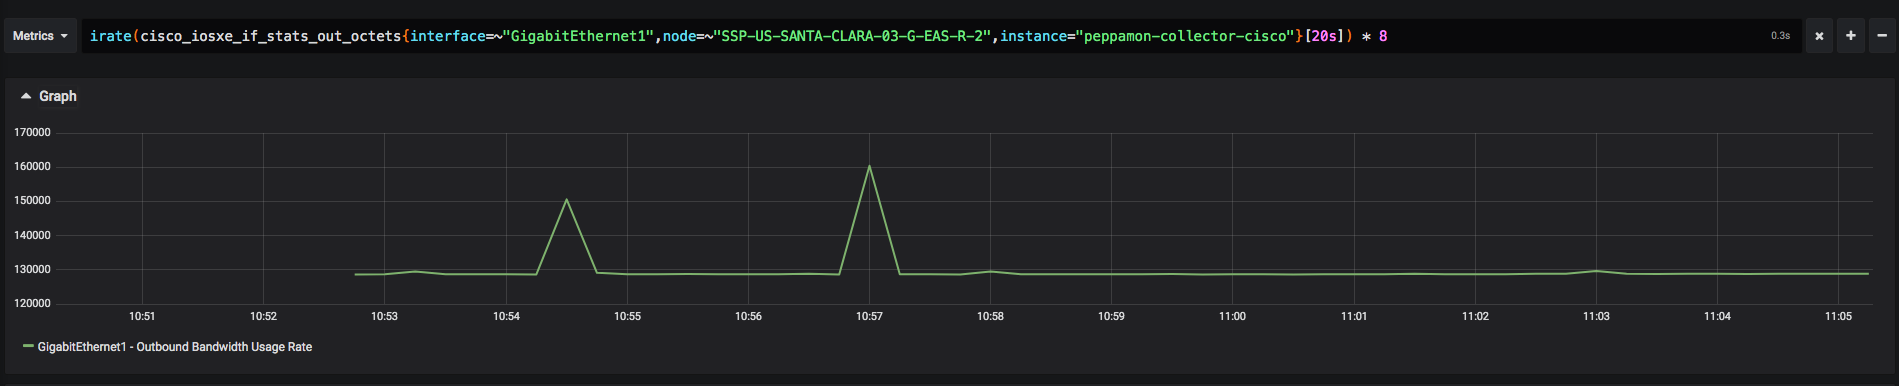
For example, the metric below records the number of octets processed by a network interface:
irate(cisco_iosxe_if_stats_out_octets{interface=~"GigabitEthernet1",node=~"SSP-US-SANTA-CLARA-03-G-EAS-R-2",instance="peppamon-collector-cisco"}[20s]) * 8
I have some intermittent spikes which are well displayed in Prometheus graph:

However, the same query in Grafana doesn’t show the spikes at all:
If I set the Min Step to 20s in Grafana, then the spikes are visible.
Unfortunately, this behavior is inconsistent depending on the node label. If I filter to a different “node” label, then the spikes are properly visible in Grafana without the Min Step.
Is there any setting / option to ensure records all spikes as Prometheus does ?
Thanks in advance.