- What Grafana version and what operating system are you using?
Grafana Cloud, latest.
- What are you trying to achieve?
Hello, I’m very new to Grafana, I have some JSON log lines from my Caddy server that I’ve managed to get into Grafana Cloud with Grafana Agent (from what I understand they are stored in ‘Loki’).
I’m trying to query these logs and display some basic visualizations based on them.
- How are you trying to achieve it?
So far, I’ve managed to use Transform after my query, in order to extract the values from the JSON, and I am able to display the logs as a table, that’s already great.
Now I want to do things like group the requests by fields like Status, Method, URI or Host, and then count the number of occurrences for each value.
I’ve managed to use the Group By transformation as described here:
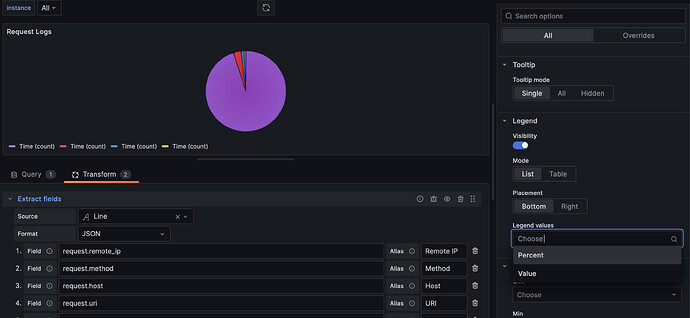
However I saw no obvious way to just count the number of rows for each grouped value, which is what I want, so as a workaround I selected ‘Count’ for the ‘Time’ Value, which should always be distinct, feels strange but it works, I do get the count of rows I want and can visualize the counts:
- What happened?
However as you can see, for any visualization I choose (pie chart, bar chart etc.) it will always just display this count value on all the legends, no matter what settings I choose for legend values etc.
- What did you expect to happen?
I would expect the value I grouped by to be displayed in the legend.
Does anyone know what I’m doing wrong?
I’ve also understood now that I could have also parsed the JSON logs in a promtail stage in Grafana Agent, instead of parsing them after the query, is this recommended? Would it make visualizing this data easier? Any thoughts?


