What Grafana version and what operating system are you using?
9.3.1
For the connection to a Database I’m using SQLite
What are you trying to achieve?
I want to separate data in a bar chart by weeks
If I want to see the whole month there should be 3 or 4 vertical lines or something which separates the data visually into the 4 weeks
How are you trying to achieve it?
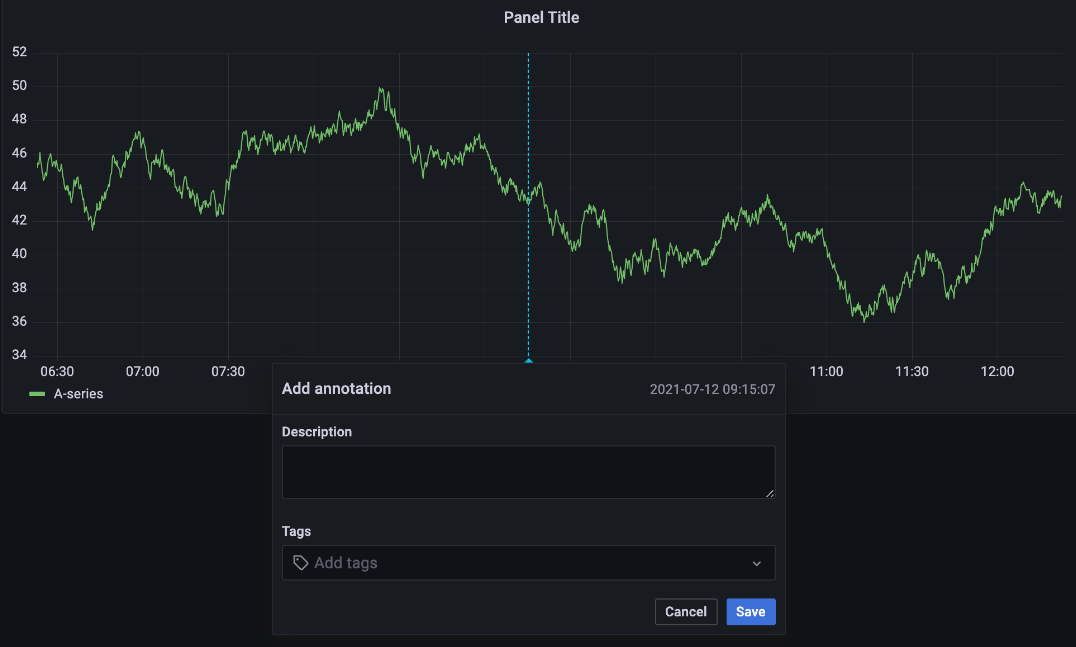
I tried it with annotations
What happened?
It didn’t worked, I couldn’t even use annotations. Neither with values nor with querying a database
What did you expect to happen?
I hoped I can separate the data (with verical lines) into weeks
Did you follow any online instructions? If so, what is the URL?
I didn’t found anything online
OK, that helps. So you are looking to insert some sort of vertical separator line. AFAIK, this does not exist as a feature, so you’d have to create a separate dataset & query do display the markers at the time, height, and color that you desire. If you manage to do it, please post back so others can benefit.