-
What Grafana version and what operating system are you using?
- 12.2.0-16677249643
-
What are you trying to achieve?
- Apply a filter on the time range with ‘filter data by values’ transformation.
-
How are you trying to achieve it?
- Create 2 custom hidden variables
$start_dateand$end_dateas set these respectively as$__fromand$__to. I do this because it is a library panel and in this dashboard doesn’t need an extra time range filter, but I cannot delete the transformation.
- Create 2 custom hidden variables
-
What happened?
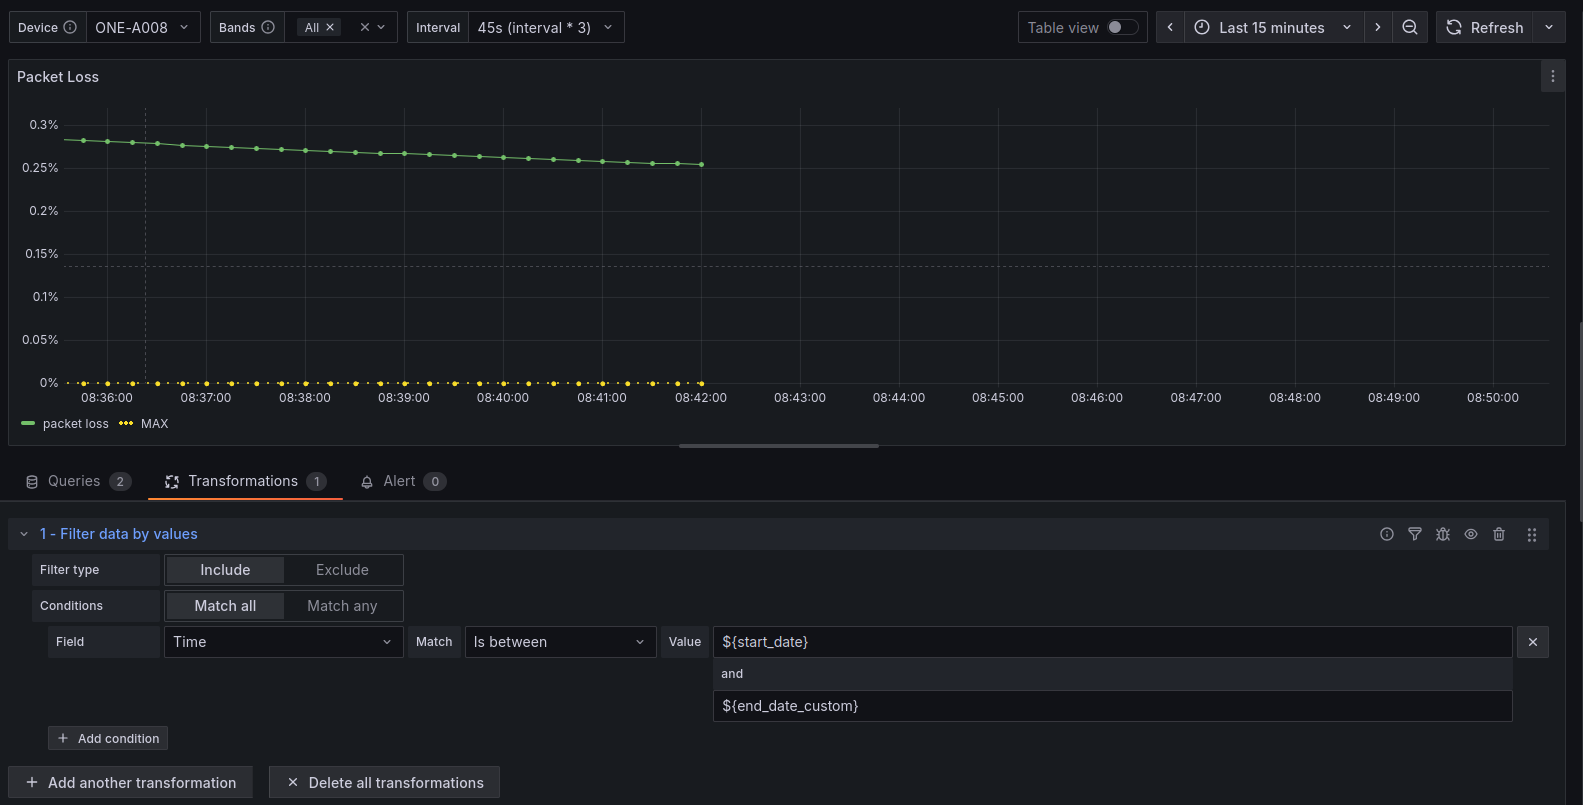
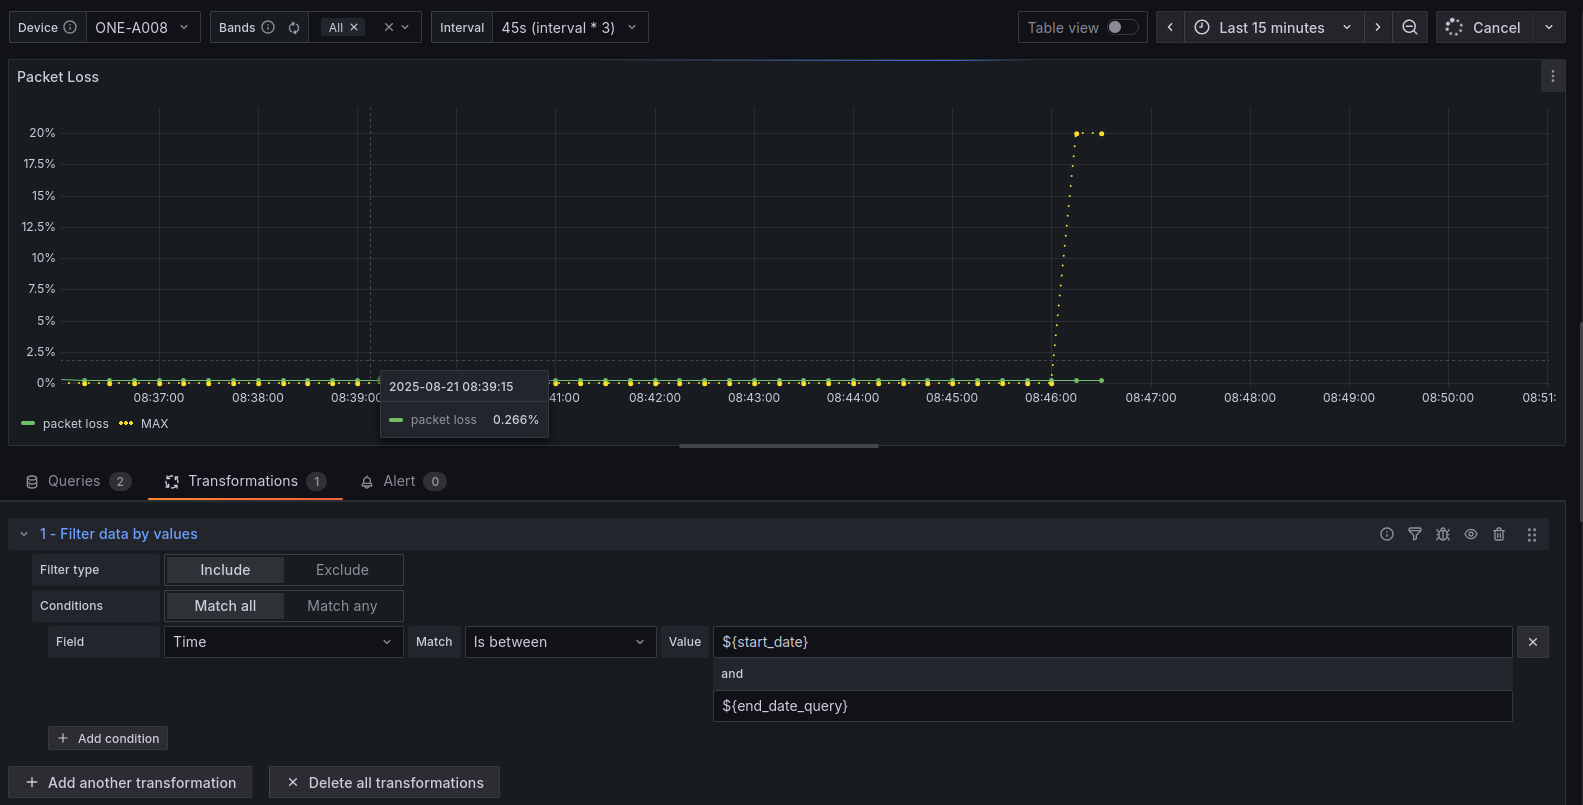
- it does not show all the data if time range is for example set to
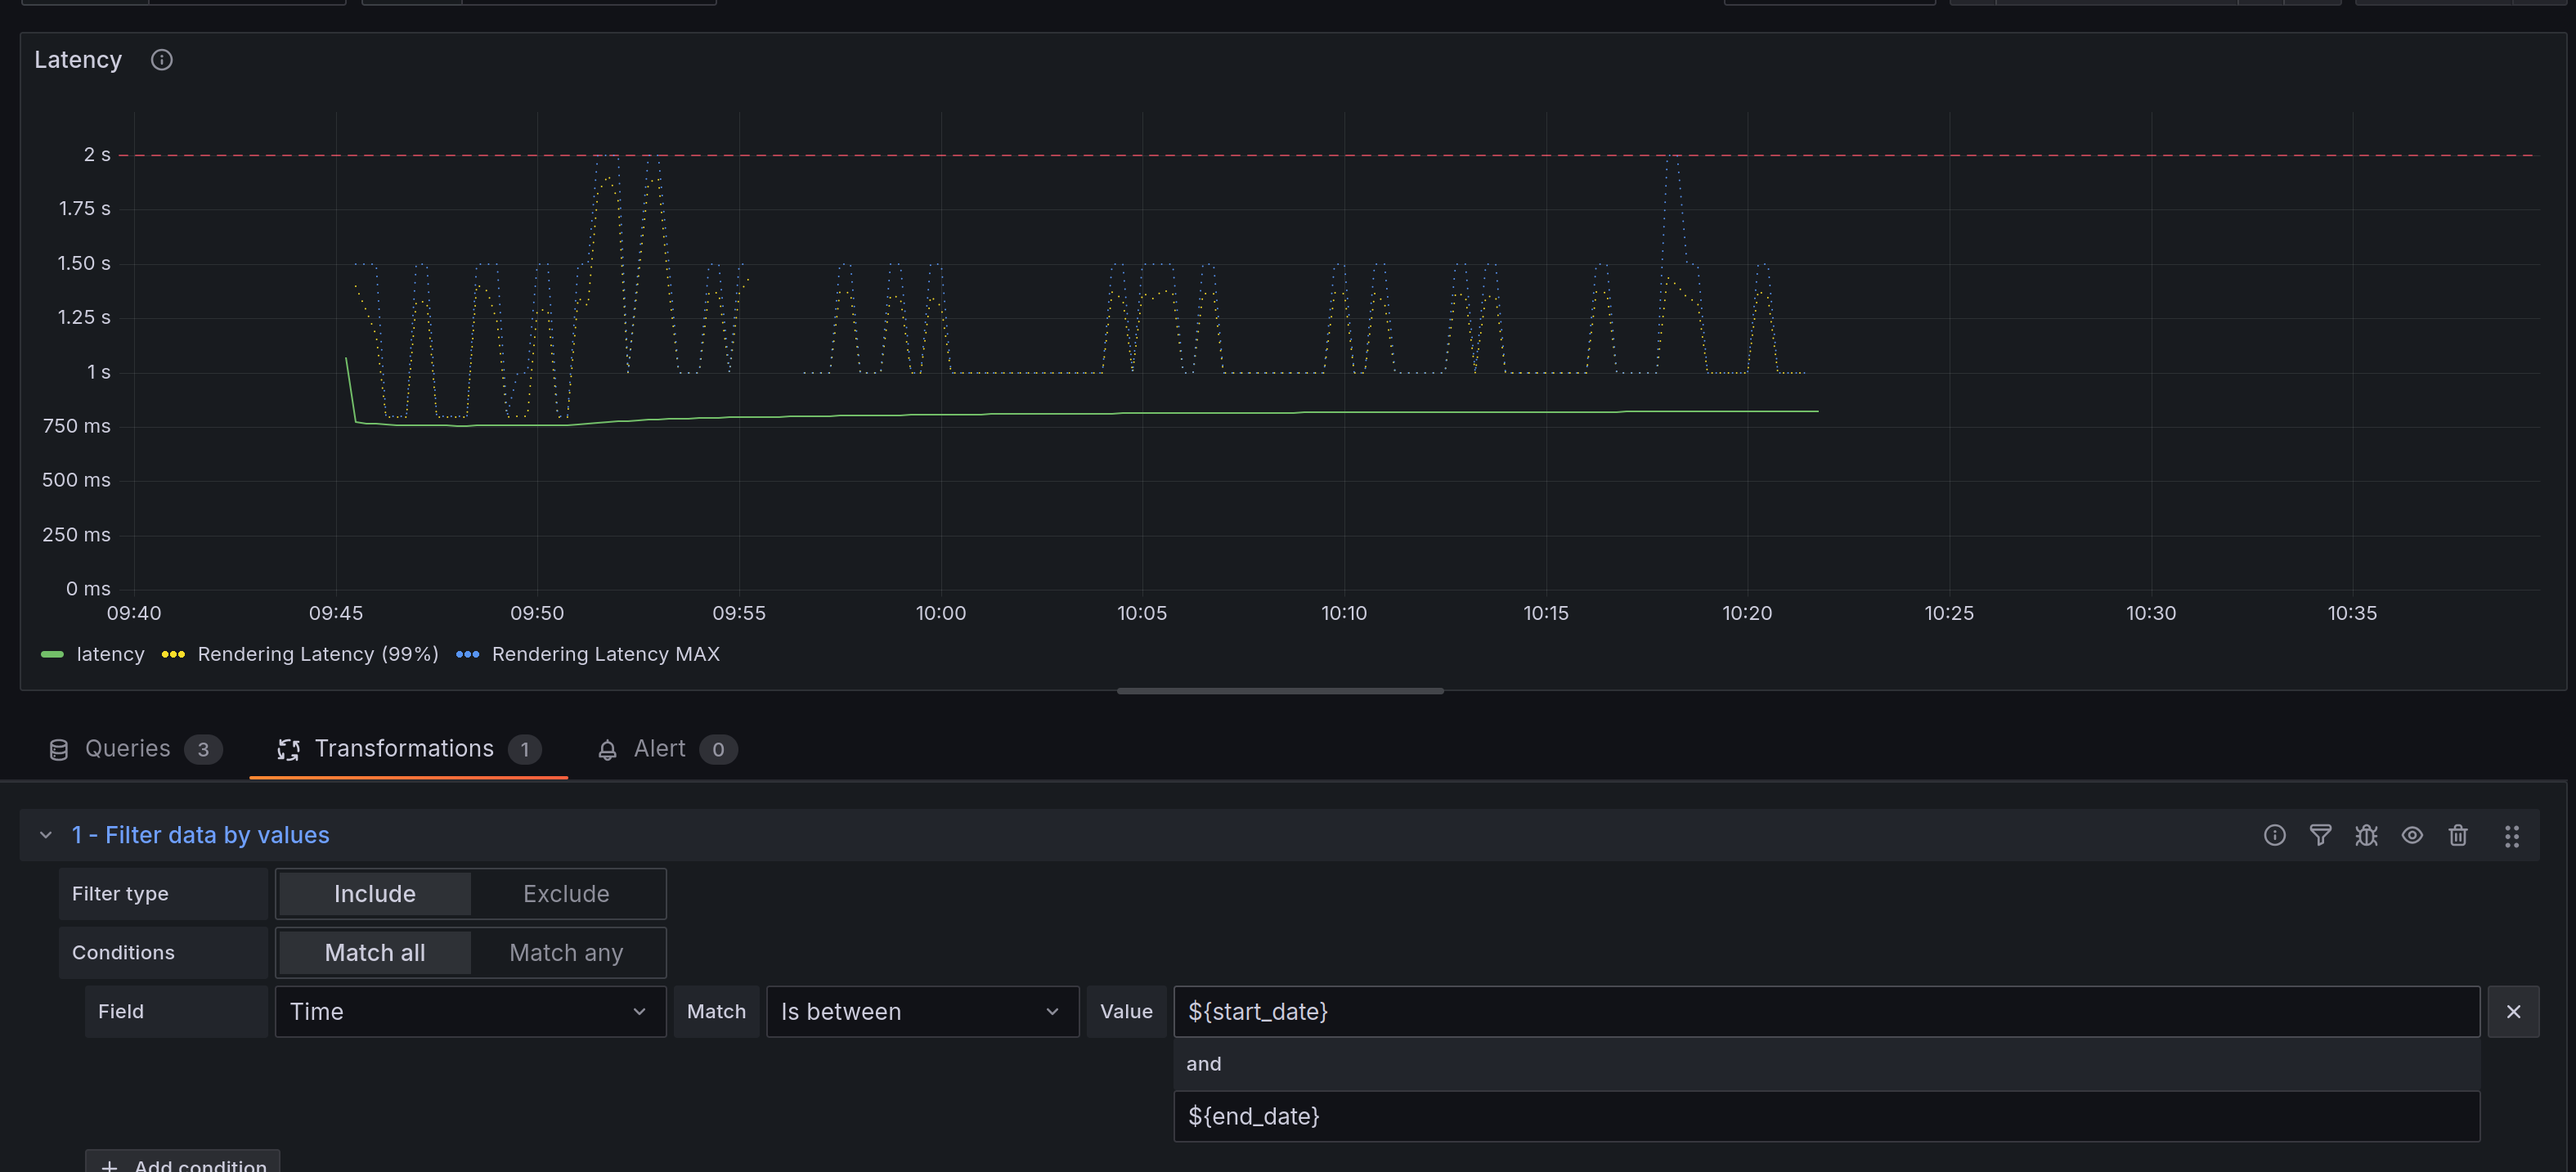
-1h(see screenshot). the last part is cut off if the filter is enabled. I other words, if the filter is set to [$start_date;$end_date] it does not show the same data as [$__from,$__to] while this is essentially the same? - without the filter
- with the filter (data after 10:20 is missing)
- it does not show all the data if time range is for example set to
-
What did you expect to happen?
- to show all the data with or without the filter enabled. that [
$start_date,$end_date] is passed the same as [$__from,$__to]
- to show all the data with or without the filter enabled. that [
-
Can you copy/paste the configuration(s) that you are having problems with?

{
  "libraryPanel": {
    "id": 30,
    "orgId": 1,
    "folderId": 14,
    "folderUid": "cegbo7j0wujuoa",
    "uid": "cesvxoltepm
gwa",
    "name": "Latency ",
    "kind": 1,
    "type": "timeseries",
    "description": "Frame Latency is the time it takes from the captured image until the end of the streaming pipeline. In other words, the streaming latency.\nRendering Latency is measured until it is shown on the screen\n",
    "model": {
      "datasource": {
        "type": "prometheus",
        "uid": "grafanacloud-prom"
      },
      "description": "Frame Latency is the time it takes from the captured image until the end of the streaming pipeline. In other words, the streaming latency.\nRendering Latency is measured until it is shown on the screen\n",
      "fieldConfig": {
        "defaults": {
          "color": {
            "mode": "palette-classic"
          },
          "custom": {
            "axisBorderShow": false,
            "axisCenteredZero": false,
            "axisColorMode": "text",
            "axisLabel": "",
            "axisPlacement": "auto",
            "barAlignment": 0,
            "barWidthFactor": 0.6,
            "drawStyle": "line",
            "fillOpacity": 0,
            "gradientMode": "none",
            "hideFrom": {
              "legend": false,
              "tooltip": false,
              "viz": false
            },
            "insertNulls": false,
            "lineInterpolation": "linear",
            "lineStyle": {
              "fill": "solid"
            },
            "lineWidth": 1,
            "pointSize": 5,
            "scaleDistribution": {
              "type": "linear"
            },
            "showPoints": "auto",
            "spanNulls": false,
            "stacking": {
              "group": "A",
              "mode": "none"
            },
            "thresholdsStyle": {
              "mode": "dashed"
            }
          },
          "fieldMinMax": false,
          "mappings": [],
          "min": 0,
          "thresholds": {
            "mode": "absolute",
            "steps": [
              {
                "color": "green",
                "value": null
              },
              {
                "color": "red",
                "value": 2000
              }
            ]
          },
          "unit": "ms"
        },
        "overrides": [
          {
            "matcher": {
              "id": "byName",
              "options": "Frame Latency (95%)"
            },
            "properties": [
              {
                "id": "custom.lineStyle",
                "value": {
                  "dash": [
                    0,
                    10
                  ],
                  "fill": "dot"
                }
              },
              {
                "id": "custom.lineWidth",
                "value": 2
              }
            ]
          },
          {
            "matcher": {
              "id": "byName",
              "options": "Rendering Latency (99%)"
            },
            "properties": [
              {
                "id": "custom.lineStyle",
                "value": {
                  "dash": [
                    0,
                    10
                  ],
                  "fill": "dot"
                }
              },
              {
                "id": "custom.lineWidth",
                "value": 1
              }
            ]
          },
          {
            "matcher": {
              "id": "byName",
              "options": "Rendering Latency MAX"
            },
            "properties": [
              {
                "id": "custom.lineStyle",
                "value": {
                  "dash": [
                    0,
                    10
                  ],
                  "fill": "dot"
                }
              }
            ]
          }
        ]
      },
      "interval": "15s",
      "options": {
        "legend": {
          "calcs": [],
          "displayMode": "list",
          "placement": "bottom",
          "showLegend": true
        },
        "tooltip": {
          "hideZeros": false,
          "mode": "single",
          "sort": "none"
        }
      },
      "pluginVersion": "12.2.0-16606054638",
      "targets": [
        {
          "datasource": {
            "type": "prometheus",
            "uid": "grafanacloud-prom"
          },
          "editorMode": "code",
          "expr": "rendering_latency_milliseconds_sum{device_id=~\"$device|$tablet\"} / (rendering_latency_milliseconds_count{ device_id=~\"$device|$tablet\"})",
          "hide": false,
          "instant": false,
          "interval": "",
          "legendFormat": "latency",
          "range": true,
          "refId": "B"
        },
        {
          "datasource": {
            "type": "prometheus",
            "uid": "grafanacloud-prom"
          },
          "editorMode": "code",
          "expr": "histogram_quantile(0.99, sum by(le) (rate(rendering_latency_milliseconds_bucket{device_id=~\"$device|$tablet\"}[${interval}])))",
          "hide": false,
          "instant": false,
          "legendFormat": "Rendering Latency (99%)",
          "range": true,
          "refId": "D"
        },
        {
          "datasource": {
            "type": "prometheus",
            "uid": "grafanacloud-prom"
          },
          "editorMode": "code",
          "expr": "histogram_quantile(1.0, sum by(le) (rate(rendering_latency_milliseconds_bucket{device_id=~\"$device|$tablet\"}[${interval}])))",
          "hide": false,
          "instant": false,
          "legendFormat": "Rendering Latency MAX",
          "range": true,
          "refId": "C"
        }
      ],
      "title": "Latency ",
      "transformations": [
        {
          "id": "filterByValue",
          "options": {
            "filters": [
              {
                "config": {
                  "id": "between",
                  "options": {
                    "from": "${start_date}",
                    "to": "${end_date}"
                  }
                },
                "fieldName": "Time"
              }
            ],
            "match": "all",
            "type": "include"
          }
        }
      ],
      "type": "timeseries"
    },
    "version": 15,
    "meta": {
      "folderName": "V2 analytics",
      "folderUid": "cegbo7j0wujuoa",
      "connectedDashboards": 2,
      "created": "2025-07-24T09:49:42Z",
      "updated": "2025-08-05T13:27:08Z",
      "createdBy": {
        "id": 10,
        "name": "tech1e46",
        "avatarUrl": "/avatar/38aceb2d2a7e727c104ea16b4546227c"
      },
      "updatedBy": {
        "id": 10,
        "name": "tech1e46",
        "avatarUrl": "/avatar/38aceb2d2a7e727c104ea16b4546227c"
      }
    }
  },
  "id": 11,
  "type": "timeseries",
  "title": "Latency ",
  "description": "Frame Latency is the time it takes from the captured image until the end of the streaming pipeline. In other words, the streaming latency.\nRendering Latency is measured until it is shown on the screen\n",
  "gridPos": {
    "x": 0,
    "y": 38,
    "h": 11,
    "w": 24
  },
  "fieldConfig": {
    "defaults": {
      "custom": {
        "drawStyle": "line",
        "lineInterpolation": "linear",
        "barAlignment": 0,
        "barWidthFactor": 0.6,
        "lineWidth": 1,
        "fillOpacity": 0,
        "gradientMode": "none",
        "spanNulls": false,
        "insertNulls": false,
        "showPoints": "auto",
        "pointSize": 5,
        "stacking": {
          "mode": "none",
          "group": "A"
        },
        "axisPlacement": "auto",
        "axisLabel": "",
        "axisColorMode": "text",
        "axisBorderShow": false,
        "scaleDistribution": {
          "type": "linear"
        },
        "axisCenteredZero": false,
        "hideFrom": {
          "tooltip": false,
          "viz": false,
          "legend": false
        },
        "thresholdsStyle": {
          "mode": "dashed"
        },
        "lineStyle": {
          "fill": "solid"
        }
      },
      "color": {
        "mode": "palette-classic"
      },
      "mappings": [],
      "thresholds": {
        "mode": "absolute",
        "steps": [
          {
            "color": "green",
            "value": null
          },
          {
            "color": "red",
            "value": 2000
          }
        ]
      },
      "fieldMinMax": false,
      "min": 0,
      "unit": "ms"
    },
    "overrides": [
      {
        "matcher": {
          "id": "byName",
          "options": "Frame Latency (95%)"
        },
        "properties": [
          {
            "id": "custom.lineStyle",
            "value": {
              "dash": [
                0,
                10
              ],
              "fill": "dot"
            }
          },
          {
            "id": "custom.lineWidth",
            "value": 2
          }
        ]
      },
      {
        "matcher": {
          "id": "byName",
          "options": "Rendering Latency (99%)"
        },
        "properties": [
          {
            "id": "custom.lineStyle",
            "value": {
              "dash": [
                0,
                10
              ],
              "fill": "dot"
            }
          },
          {
            "id": "custom.lineWidth",
            "value": 1
          }
        ]
      },
      {
        "matcher": {
          "id": "byName",
          "options": "Rendering Latency MAX"
        },
        "properties": [
          {
            "id": "custom.lineStyle",
            "value": {
              "dash": [
                0,
                10
              ],
              "fill": "dot"
            }
          }
        ]
      }
    ]
  },
  "transformations": [
    {
      "id": "filterByValue",
      "options": {
        "filters": [
          {
            "config": {
              "id": "between",
              "options": {
                "from": "${start_date}",
                "to": "${end_date}"
              }
            },
            "fieldName": "Time"
          }
        ],
        "match": "all",
        "type": "include"
      },
      "disabled": true
    }
  ],
  "pluginVersion": "12.2.0-16677249643",
  "targets": [
    {
      "datasource": {
        "type": "prometheus",
        "uid": "grafanacloud-prom"
      },
      "editorMode": "code",
      "expr": "rendering_latency_milliseconds_sum{device_id=~\"$device|$tablet\"} / (rendering_latency_milliseconds_count{ device_id=~\"$device|$tablet\"})",
      "hide": false,
      "instant": false,
      "interval": "",
      "legendFormat": "latency",
      "range": true,
      "refId": "B"
    },
    {
      "datasource": {
        "type": "prometheus",
        "uid": "grafanacloud-prom"
      },
      "editorMode": "code",
      "expr": "histogram_quantile(0.99, sum by(le) (rate(rendering_latency_milliseconds_bucket{device_id=~\"$device|$tablet\"}[${interval}])))",
      "hide": false,
      "instant": false,
      "legendFormat": "Rendering Latency (99%)",
      "range": true,
      "refId": "D"
    },
    {
      "datasource": {
        "type": "prometheus",
        "uid": "grafanacloud-prom"
      },
      "editorMode": "code",
      "expr": "histogram_quantile(1.0, sum by(le) (rate(rendering_latency_milliseconds_bucket{device_id=~\"$device|$tablet\"}[${interval}])))",
      "hide": false,
      "instant": false,
      "legendFormat": "Rendering Latency MAX",
      "range": true,
      "refId": "C"
    }
  ],
  "datasource": {
    "type": "prometheus",
    "uid": "grafanacloud-prom"
  },
  "interval": "15s",
  "options": {
    "tooltip": {
      "mode": "single",
      "sort": "none",
      "hideZeros": false
    },
    "legend": {
      "showLegend": true,
      "displayMode": "list",
      "placement": "bottom",
      "calcs": []
    }
  }
}
-
Did you receive any errors in the Grafana UI or in related logs? If so, please tell us exactly what they were. NO
-
Did you follow any online instructions? If so, what is the URL? NO