Optimizing low volume monolitic instance

Hey everyone,

I’m using loki for a project where it serves as a log service mostly for network equipments related logs.

We are speaking of very low volume of logs, especially regarding what’s configured by default for loki. They often don’t log more than a few lines per equipment / flow (as we are using hostname for easier querrying as label.) per hours via an rsyslog/promtail service.

We have some flows, for example from radius servers that send more lines and are more voluminous, but still, it’s not that much entries per hours.

Thus, we are trying to optimise our instance for our usage, but we are faced with a lack of proper experience for this case of usage.
We are simply running a single monolitic instance with local storage as we have to and don’t need high availability deployment, and require no usage of S3 compactible/aws/gcs object storage.

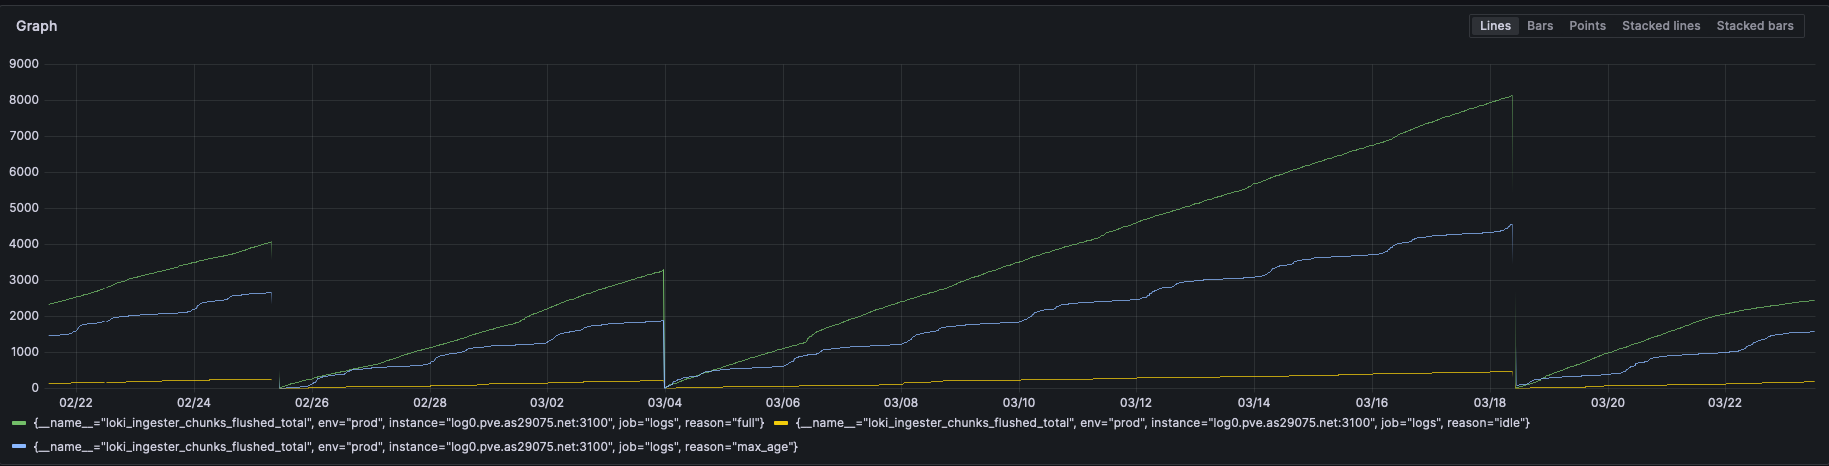
Still we would love to have some hints about optimising loki for this case of use. The kind of twerks we’ve made so far is to make the chunk less likely to expire with max_chunk_age to 48h, smallers chunk_block_size to 65536, and no target_size to 0, chunk_idle_period to 24h.
Doing these twerks, we couldn’t be able to see real change in overall performances.

The aim here is to create less chunk, so less files for low logs flow, and still remain acceptable for bigger flow.

We aim as well to be able to use large query period (month at least) without exploding the instance. To do so, we’ve already had to increase maximum files linmit of systemd service, because it could happen for us to reach it.

Do you think we are following the proper way to optimize this loki deployment? Do you think we should do something completely different?

We know this is kind of the opposite of what loki’s been made for (ingesting lots of logs), but the tools regarding visualisation/alerting/sorting/querrying/websocket are necessary for us.

I hope this case of use will be of interest to you.

Best regards

I’ve not run single instance Loki before, so I can’t speak from experiences. Your adjustments seem fine, except maybe I’d not modify chunk_block_size. What difference did you notice with these configuration changes? Did you observe less chunks overall?

Well, our min objective is of course reducing the number of files, while not making them bigger, and keeping everything balanced. I still get quite a lots of chunks everyday, most of them compressed are around ~35k, some few are barely empty (less than 1k) and some reach the targeted block size.
Like I’ve said, we currently were unable to be see any change around performance.

I still have a chunk_target_size to 0 creating compressions of 10chunks, i think I should set a large value to decrease the amount of chunk files maybe to increase a lot the size of these blocs to increase I/O efficiency, as these files are way too small in my opinion, targeting chunks around 1M should be a great target to begin with I think to increase performance globally, but it’s not easy with such kind of logs inputs. Grouping flow (while not having that much) would not be an option as well because it would be impossible to properly query certain hosts.

Twerking everything is hard to be certain of every consequences…

You are currently setting chunk age to 48h and idle period to 24h, that means at minimum your chunk should be 24 hours old when written to the file system. Does this seem true?

You can also query your injester’s /metric endpoint, look for specifically loki_ingester_chunks_flushed_total, which should tell you, with a bit of calculation or graphing, the percentage of chunks flushed for what reason.

Sorry for not responding for some time, got busy on other topics.
Yes, this metric was showing if there is a here a lot of them that goes to storage while beeing full while before these change a lot of them where going to max_age

Here’s what we have now: