How to log from my node application using winston ?
I can find one article about it. But that howto requires patching to make it work,
Sending a log from an application must be pretty basic. But I can’t find any examples.
I hope someone has a simple example of getting a log from an application running in nodejs.
A simple “Hello world”
In your example, the host is on the same machine as the node app is running.
I would prefer not to set up grafana system myself. Rather use the Grafana Cloud Free account ( Grafana Cloud | Observability platform overview ).
As Dan Mihai Dinu writes in his post - winston-loki does not work when sending logs to the hosted grafana service.
Bummer, it doesn’t work. After a good hour of debugging, I noticed that winston-loki works fine with local instances of Grafana Loki, but it doesn’t authenticate properly to send requests to Grafana Cloud Logs
From the screenshot in his article, I see that the version he is patching is winston-loki 6.0.5.
The latest version is now 6.0.6 and I don’t know if the problem is fixed or not. And I’m not sure if his patch for version 6.0.5 will work on 6.0.6.
To me, this seems like a bug. But I’m not sure whether it is in Grafana cloud or winston-loki.
It works just fine. There is a undocumented part in his article. That is the first parameter in values. In my example, when I tested yesterday, I set it to “1669731652002000001”,
It is the UNIX timestamp ( https://www.unixtimestamp.com/)
Hi
In my previous post I was just pointing out that it is possible to send log directly to grafana cloud using the API.
I could implement my own function to just send my log directly to grafana cloud using that API. Then there would be no need for winston-loki at all.
But I’m sure that the internal workings of winston-loki is more complex than just a wrapper to that API. So it is better to solve the problem in the winston-loki.
/* The siplest test ever to see if grafana cloud and winston is working
A small node app that sends a log message to Grafana Cloud Loki using the winston-loki transport.
To you by terchris and friends.
*/
import winston from "winston";
import LokiTransport from "winston-loki"
// https://grafana.com/orgs/urbalurba (change urbalurba to your own org)
// in the Loki card. Click on the Details button. On the next page you will se the Grafana Data Source settings.
// Create a password and replace the const variables below with your own values.
const GRAFANA_HOST = "https://logs-prod-eu-west-0.grafana.net";
const MY_APP_NAME = "urbalurba";
const GRAFANA_USERID = "333666";
const GRAFANA_PASSWORD = "eyJr1234567890FjYzZlOTg2NTE5ZDIyY12345678900ODdlZjAx1234567890IsIm4iOiJ1234567890iwi1234567890cyM30=";
// start leave this as is
const GRAFANA_BASICAUTH = GRAFANA_USERID + ":" + GRAFANA_PASSWORD;
const logger = winston.createLogger({
level: 'debug',
transports: [
new LokiTransport({
host: GRAFANA_HOST,
labels: { app: MY_APP_NAME },
json: true,
basicAuth: GRAFANA_BASICAUTH,
format: winston.format.json(),
replaceTimestamp: true,
onConnectionError: (err) => console.error(err)
}),
new winston.transports.Console({}),
],
});
// end leave this as is
// send some log messages
logger.info("Starting test");
logger.debug("sending debug message");
logger.warn("sending warn message");
logger.error("sending error message");
logger.info("done testing");
// To see the logging in grafana cloud, go to Explore https://urbalurba.grafana.net/explore (change urbalurba to your own org)
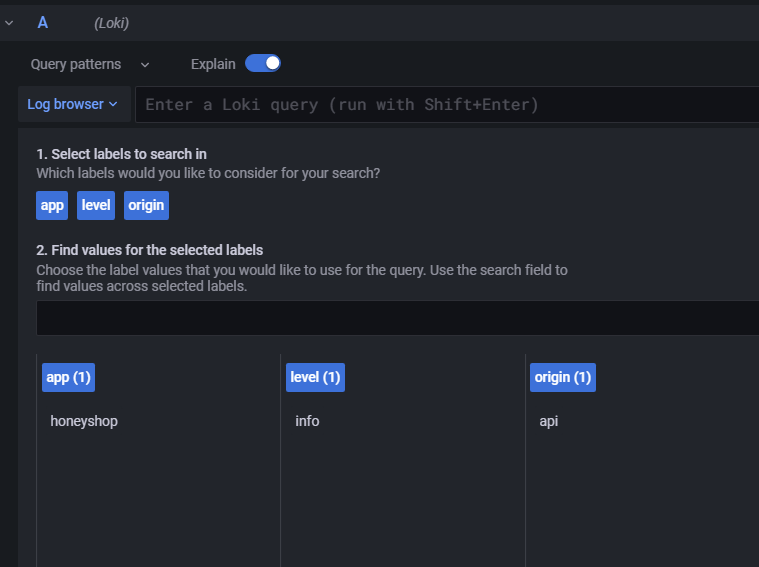
// At the top there is a dropdown. Select the one with the Loki logo (in my case grafanacloud-urbalurba-logs)
// In the "Select label" dropdown select "app" and in the "Select value" dropdown select "urbalurba" (change urbalurba to your own app name)
// Click on the "Run Query" button in the upper right corner. You should see the log messages you sent above.
@terchris Hey there.
I tried hitting the url using postman. I’m getting a 204 response and the labels are also getting created in Loki but the logs shows “No logs found” What am I missing? TIA
Update: The logs for the post request that I made yesterday is showing up now. But its not showing for the recent requests. I guess there is a lag. Any help will be appreciated.
@architectinprogress I was facing the same issue, look at the timestamp in nanoseconds that you send and see that the endpoint matches the one needed for Loki! Note: by default, Grafana only looks 6h ago. POSThttps://<username>:<api_key>@<subdomain>.grafana.net/loki/api/v1/push