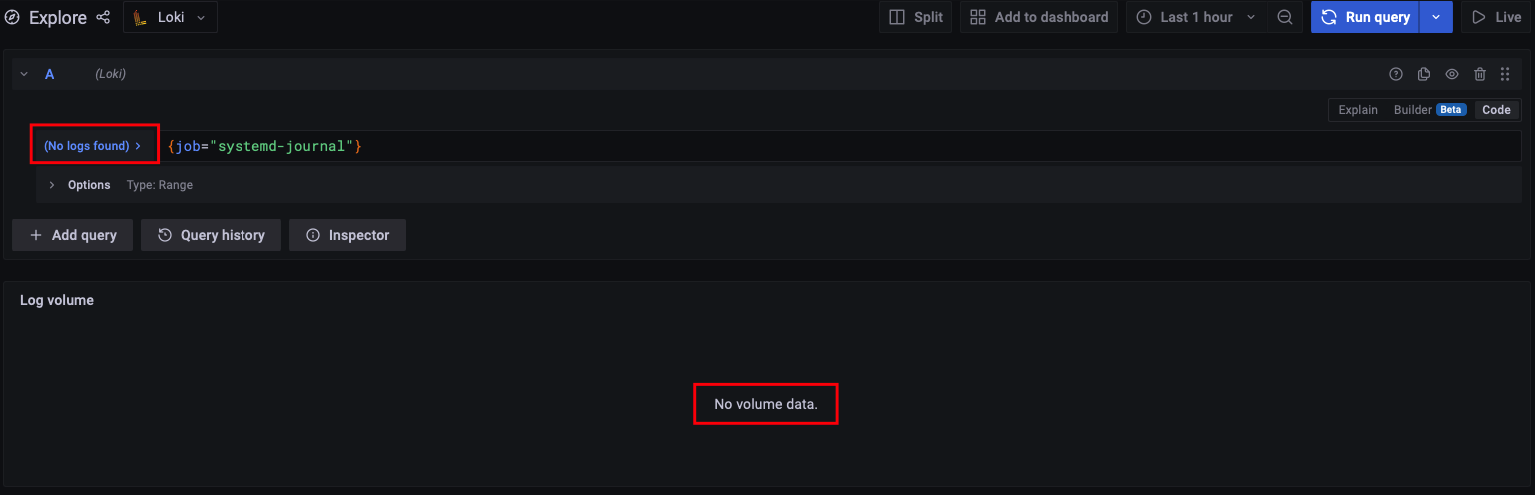
No logs and no labels showing in Loki

Describe the bug
I’ve been trying to troubleshoot an issue with Loki not displaying any logs or labels:

Screenshot at Jun 18 23-16-03

A few things to try:

  • Open the network tab and see if data is being returned but not displayed.
  • Give the labels API endpoint a try and see if it returns any data (this will help determine if the problem is at the Grafana server layer). This can be done manually or via logcli.

Originally posted by @owen-d in #2300 (comment)

http://localhost:3100/loki/api/v1/labels?end=1655608629275381800&start=1655605029275381800
__name__

Environment:

  • Infrastructure: Raspi running Raspbian 10 (Buster)

Screenshots, Promtail config, or terminal output

Contents of /usr/local/bin/loki-local-config.yaml:

server:
  http_listen_port: 3100
  grpc_listen_port: 9096

ingester:
  wal:
    enabled: true
    dir: /tmp/wal
  lifecycler:
    address: 127.0.0.1
    ring:
      kvstore:
        store: inmemory
      replication_factor: 1
    final_sleep: 0s
  chunk_idle_period: 1h       # Any chunk not receiving new logs in this time will be flushed
  max_chunk_age: 1h           # All chunks will be flushed when they hit this age, default is 1h
  chunk_target_size: 1048576  # Loki will attempt to build chunks up to 1.5MB, flushing first if chunk_idle_period or max_chunk_ag$
  chunk_retain_period: 30s    # Must be greater than index read cache TTL if using an index cache (Default index read cache TTL is$
  max_transfer_retries: 0     # Chunk transfers disabled

schema_config:
  configs:
    - from: 2020-10-24
       store: boltdb
      object_store: filesystem
      schema: v11
      index:
        prefix: index_
        period: 168h

storage_config:
   boltdb:
     directory: /data/loki/index
   filestystem:
     directory: /data/loki/chunks

limits_config:
  enforce_metric_name: false

Contents of /usr/local/bin/promtail-local.config.yaml:

  http_listen_port: 9080
  grpc_listen_port: 0

positions:
  filename: /data/loki/positions.yaml

clients:
  - url: http://localhost:3100/loki/api/v1/push

scrape_configs:
- job_name: system
  static_configs:
  - targets:
      - localhost
    labels:
      job: varlogs
      __path__: /var/log/*log
      __path__: /var/log/grafana/*log
      __path__: /var/log/lighttpd/*log
      __path__: /var/log/letsencrypt/*log
      __path__: /var/log/apt/*log

So I managed to get a working configuration of this by re-downloading the binaries and config files. Loki now sees the /var/log/*log files, but any time I search one of them I get the following message:

Get "http://localhost:3100/loki/api/v1/query_range?direction=backward&end=1656268690423000000&limit=1000&query=sum+by+%28level%29+%28count_over_time%28%7Bfilename%3D%22%2Fvar%2Flog%2Fufw.log%22%7D%5B1m%5D%29%29&start=1656265090423000000&step=60000ms": dial tcp 127.0.0.1:3100: connect: connection refused

I’ve checked and UFW shows port 3100 and 9080 is open on v4 and v6, so I’m not sure where else to go at this point.

EDIT: well this was working, but after copying the known working files from ~/loki to /usr/local/bin/loki I’m getting the following error:

level=error ts=2022-06-26T19:47:52.474704917Z caller=log.go:100 msg="error running loki" err="open /tmp/loki/wal/00000015: permission denied\nerror initialising module: ingester\ngithub.com/grafana/dskit/modules.(*Manager).initModule\n\t/src/loki/vendor/github.com/grafana/dskit/modules/modules.go:108\ngithub.com/grafana/dskit/modules.(*Manager).InitModuleServices\n\t/src/loki/vendor/github.com/grafana/dskit/modules/modules.go:78\ngithub.com/grafana/loki/pkg/loki.(*Loki).Run\n\t/src/loki/pkg/loki/loki.go:339\nmain.main\n\t/src/loki/cmd/loki/main.go:108\nruntime.main\n\t/usr/local/go/src/runtime/proc.go:255\nruntime.goexit\n\t/usr/local/go/src/runtime/asm_arm.s:838"

The original files are still in ~/loki and even running from that directory I still get the same error. Literally nothing has changed on the permissions for /tmp/loki, so I’m not sure what the heck is happening.

Hi, I had the same issue
I installed loki-stack helm. In values.yaml, i added -loki to promtail.config.lokiAddress like this:

  promtail:
    enabled: true
    config:
      # default: lokiAddress: http://{{ .Release.Name }}:3100/loki/api/v1/push
      lokiAddress: http://{{ .Release.Name }}-loki:3100/loki/api/v1/push

Hope this help you!

This topic was automatically closed 365 days after the last reply. New replies are no longer allowed.