Hi! So I couldn’t find one so I made one.
It’s rough around the edges yet, it’s based on https://react-wordcloud.netlify.com/
I need to document it yet but it is intended to use with elasticsearch datasource.
It’s my first plugin (new to react too), any comments or suggestions would be welcome!
I’m actually using it in that version. Just clone the repository (or download this and extract it ) in grafana plugins directory. You should see it in grafana logs when it starts.
@raulsperoni Thanks for making this plugin! It worked great in 6.x. I’m having trouble with it in 7 and was wondering if some of the changes affected the plugin.
I get this error message on my existing wordcloud panels:
When I create a new panel and select the wordcloud panel from the visualization panel (on the right), as soon as I make a new panel I get this:
I tried downloading the plugin many ways. I used git to clone the repo to the plugins directory(/var/lib/grafana/plugins/), downloaded both the zip and tar.gz file to my computer then transfered the file grafana with scp(SFTP) before “unzipping” to the plugins directory, curl the download link (curl -X GET $LINK > $FILENAME and unzipping it in the plugins directory.
If you need to know anything else, feel free to ask!
Hey, look the plugin was working for me even after upgrading grafana to 7, and honestly I don’t see any hint of what may be wrong in your case.
But, this was a good chance for me to try the new plugin arquitecture, so I upgraded everything to 7, moved the code to github and asked for this plugin to be in the list.
I am using influxDB and a measurement (table) having structure like this
COLUMNS
TAGS - time,ipAddress,searchTerm
VALUE - value
Sample set of rows looks like this
timestamp Ip Address searchTerm Value
1567799009999 134.345.34.456 covid-19 1
1567799009999 134.345.34.456 vaccine 1
1567799009899 134.345.24.456 vaccine 1
the value will always be 1 for every row. I want a word cloud of the search terms based on the number of times a term was searched. For this I selected sum(value) and grouped by the tag searchTerm, but to no avail.
Please let me know what I am missing. Any help would be much appreciated.
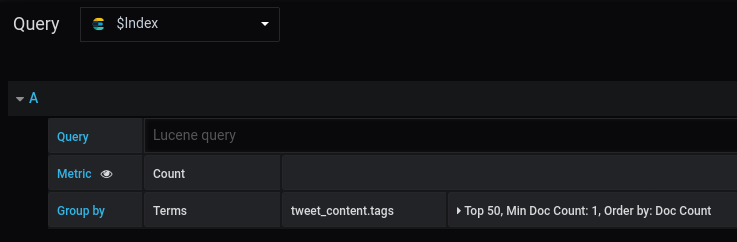
Hi! are you grouping by “terms” (like in the image I posted earlier)?
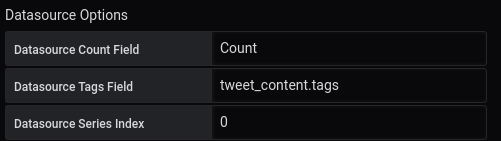
Also, the names of both columns should be configured in the options tab. Defaults wont work for you.
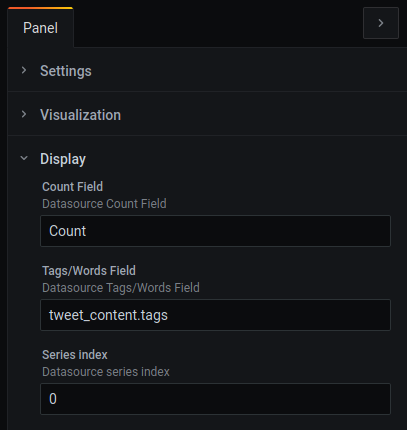
Your columns, or fields, will have different names. “Count” is the name of the metric, you could use another, it doesn’t matter. (I hope this answers 1. ) But then you have to change the options panel accordingly:
There, you need to put your Columns/Fields names ( andthis answers 2. )
could u please explain how to build a customized plugin.
Am a beginner and am trying for that …
I tried scatter plot plugin development as given in Grafana tutorial.
And not able to give live data.
Hi @raulsperoni - after configuring the columns in the option tab, my dashboard still does not show any data (attachment). Please let me know what I am missing here


 I’m yet to upgrade to 7, and will of course need to make this work.