Hi, im new to grafana with limited experience with elk. In Kibana i can setup bar diagrams etc based on the same data but find it alot harder in grafana. Probably due to my limited knowledge of how to query.
This project is a spinoff from pfELK.
In the first picture below you can se 2 basic tables with what i want to know, first the number of severity alarms. I don’t seem to be able to even make a graph based on that. The corraltion between the number of alerts and severity.
When the count of severity 1 is above 0 i want an alarm.
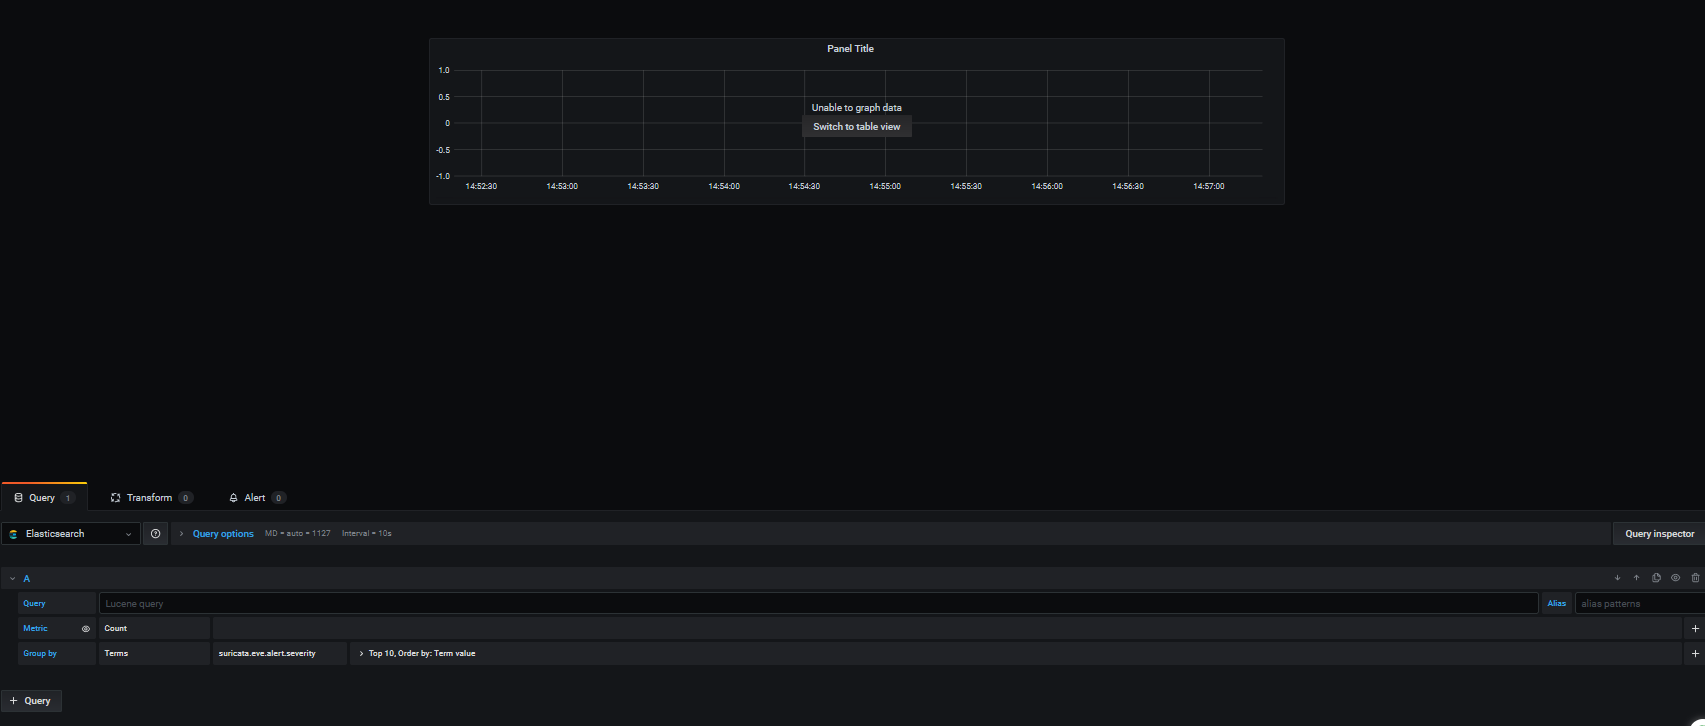
In the 2nd picture you can see my query for this table. Unable to create a graph. How do you choose what to be on what axis ?!?