In Grafana Dashboard We have to add variable for Region and Avialability Zone
We select Region It should show Availability Zones in that region
Can anyone help me with this query??
In Grafana Dashboard We have to add variable for Region and Avialability Zone
We select Region It should show Availability Zones in that region
Can anyone help me with this query??
What is your datasource? Mysql or postgres?
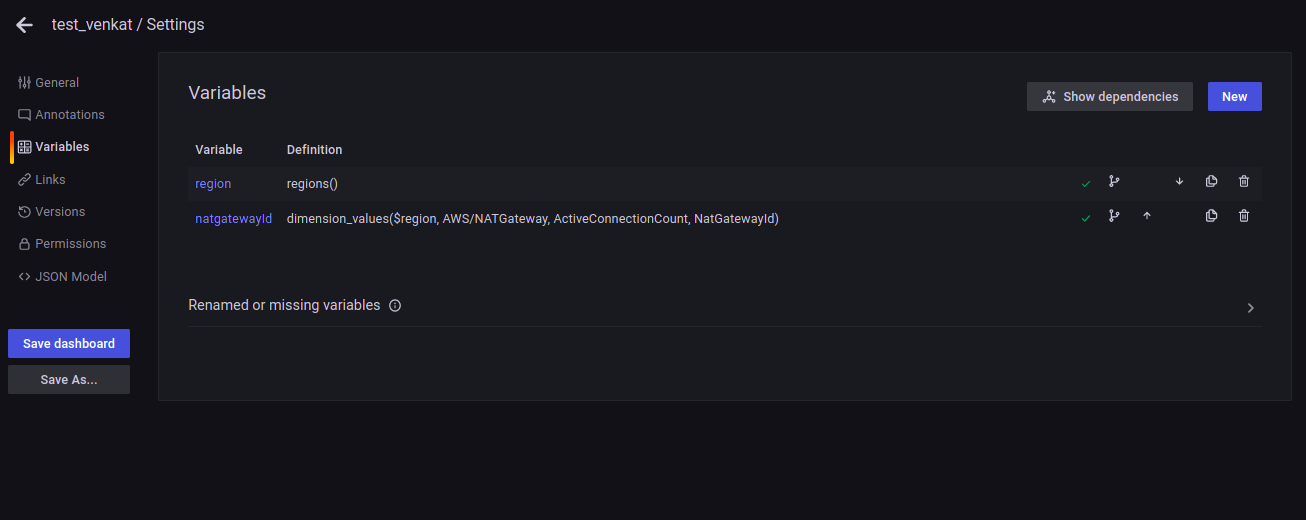
our Data source is cloudwatch, we need like this image, instead of natgateway id we have to get Availabilityzone
does Availabilityzone have regionid or region value?

it should show us like, How it looks in AWS, looks like this image, Can you consider these two pics, While i am trying to write it throwing some error

what errors is it throwing?
It was thrown some errors and i didn’t saved that dashboards, i am trying continuously, Can you share the query you tried, I will also try to figure it out
that doesn’t help… ![]()
AWS/NATGateway metrics don’t have availability zone dimension, so you can’t filter by availability zone: Monitor NAT gateways with Amazon CloudWatch - Amazon Virtual Private Cloud Your requirement doesn’t make sense.
@jangaraj we don’t need need natgateway’s, Instead of nategateway’s we need AvailabilityZone’s , I just shared that as reference