I could use some help with the bar gauge; I can’t seem to get it do what I wanted. I get two metrics per series out of my InfluxDB query, like this:
select last(pageslot) as slot, last(pageused) as used from sytasg
where time > now() - 3m and ssi = ‘RMHSSI’ group by systmid
name: sytasg
tags: systmid=VMA
time slot used
---- ---- ----
1598879579639844383 1802880 1482978
name: sytasg
tags: systmid=VMB
time                slot    used
----                ----    ----
1598879579639844383 1802880 846955

name: sytasg
tags: systmid=VMC
time                slot    used
----                ----    ----
1598879579639844383 1803048 610984

name: sytasg
tags: systmid=VMD
time                slot    used
----                ----    ----
1598879579639844383 1802880 38456
When I put that in a bar gauge, it looks like this:
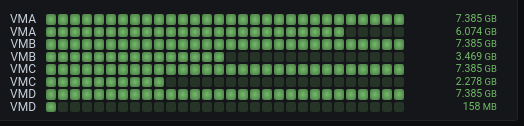
What I would like to have is one bar per system name, and have the two values with different colors. I could subtract used from total to have two values that can be stacked, if that does the trick.