Displaying 4 fields in a Bar Gauge

I’ve just installed Grafana, and trying to create a Bar Gauge to display 4 values from the CPU plugin - ‘usage_user’ measurement - cpu0, cpu1, cpu2, cpu3.
I can retrieve those 4 plus cpu-total, but cannot filter just cpu0, cpu1, cpu2, cpu3

5

Also, note that the labels are all the same, so I cannot differentiate between the cpu’s

My current query is;

from(bucket: "oracle metrics")
  |> range(start: v.timeRangeStart, stop:v.timeRangeStop)
  |> filter(fn: (r) =>
    r._measurement == "cpu" and
    r._field == "usage_user" 
  )

Does anyone have a flex example query to achieve the above, and that I can use as a template to learn from.
I’ve watched the learning videos, and read the guide but it hasn’t really helped…

Please share your data with inline csv like the following

bucket_name, _measurement,usage_user,value
oracle metrics,cpu,cpu0,13

I’m sorry, I’m using and trying to learn flux, I have no idea what inline csv is, or how to share it.
Doesn’t the flux query that I posted above describe the data?

this is inline csv

bucket_name, _measurement,usage_user,value
oracle metrics,cpu,cpu0,13

what you posted does describe it, but if you want a more accurate answer we need the data cause…we dont have access to your influxdb :wink:

How do I get the data that you want? I’ve googled it and not found any answers, and also done some more influx docs reading, but I’m no further forward.

Hi Paul,

Could you put this into Influx Data Explorer and toggle the switch to View Raw Data, the paste the output here?

from(bucket: "oracle metrics")
  |> range(start: v.timeRangeStart, stop:v.timeRangeStop)
  |> filter(fn: (r) =>
    r._measurement == "cpu" and
    r._field == "usage_user" 
  )
  |> yield(name:"test_data")

See below (obviously no results for me, but should be for you):

1 Like

:point_up::point_up:t6: you either type it out as I did above or download it from influxdb explorer as csv and copy paste here as text

Here is the output;

#group	false	false	true	true	false	false	true	true	true	true
#datatype	string	long	dateTime:RFC3339	dateTime:RFC3339	dateTime:RFC3339	double	string	string	string	string
#default	test_data									
	result	table	_start	_stop	_time	_value	_field	_measurement	cpu	host
		0	2023-04-04T21:46:14.587081419Z	2023-04-04T21:47:14.587081419Z	2023-04-04T21:46:20Z	12.670025188917	usage_user	cpu	cpu-total	server-a
		0	2023-04-04T21:46:14.587081419Z	2023-04-04T21:47:14.587081419Z	2023-04-04T21:46:30Z	12.7401415571282	usage_user	cpu	cpu-total	server-a
		0	2023-04-04T21:46:14.587081419Z	2023-04-04T21:47:14.587081419Z	2023-04-04T21:46:40Z	12.8101265822786	usage_user	cpu	cpu-total	server-a
		0	2023-04-04T21:46:14.587081419Z	2023-04-04T21:47:14.587081419Z	2023-04-04T21:46:50Z	12.7520161290323	usage_user	cpu	cpu-total	server-a
		0	2023-04-04T21:46:14.587081419Z	2023-04-04T21:47:14.587081419Z	2023-04-04T21:47:00Z	12.9408779497589	usage_user	cpu	cpu-total	server-a
		1	2023-04-04T21:46:14.587081419Z	2023-04-04T21:47:14.587081419Z	2023-04-04T21:46:20Z	12.3742454728371	usage_user	cpu	cpu0	server-a
		1	2023-04-04T21:46:14.587081419Z	2023-04-04T21:47:14.587081419Z	2023-04-04T21:46:30Z	12.6903553299492	usage_user	cpu	cpu0	server-a
		1	2023-04-04T21:46:14.587081419Z	2023-04-04T21:47:14.587081419Z	2023-04-04T21:46:40Z	12.4626121635095	usage_user	cpu	cpu0	server-a
		1	2023-04-04T21:46:14.587081419Z	2023-04-04T21:47:14.587081419Z	2023-04-04T21:46:50Z	12.5754527162979	usage_user	cpu	cpu0	server-a
		1	2023-04-04T21:46:14.587081419Z	2023-04-04T21:47:14.587081419Z	2023-04-04T21:47:00Z	12.9459734964321	usage_user	cpu	cpu0	server-a
		2	2023-04-04T21:46:14.587081419Z	2023-04-04T21:47:14.587081419Z	2023-04-04T21:46:20Z	12.4875124875125	usage_user	cpu	cpu1	server-a
		2	2023-04-04T21:46:14.587081419Z	2023-04-04T21:47:14.587081419Z	2023-04-04T21:46:30Z	12.7144298688195	usage_user	cpu	cpu1	server-a
		2	2023-04-04T21:46:14.587081419Z	2023-04-04T21:47:14.587081419Z	2023-04-04T21:46:40Z	12.9327902240323	usage_user	cpu	cpu1	server-a
		2	2023-04-04T21:46:14.587081419Z	2023-04-04T21:47:14.587081419Z	2023-04-04T21:46:50Z	12.8542510121459	usage_user	cpu	cpu1	server-a
		2	2023-04-04T21:46:14.587081419Z	2023-04-04T21:47:14.587081419Z	2023-04-04T21:47:00Z	12.8153380423816	usage_user	cpu	cpu1	server-a
		3	2023-04-04T21:46:14.587081419Z	2023-04-04T21:47:14.587081419Z	2023-04-04T21:46:20Z	12.7659574468086	usage_user	cpu	cpu2	server-a
		3	2023-04-04T21:46:14.587081419Z	2023-04-04T21:47:14.587081419Z	2023-04-04T21:46:30Z	12.7766599597584	usage_user	cpu	cpu2	server-a
		3	2023-04-04T21:46:14.587081419Z	2023-04-04T21:47:14.587081419Z	2023-04-04T21:46:40Z	12.8048780487805	usage_user	cpu	cpu2	server-a
		3	2023-04-04T21:46:14.587081419Z	2023-04-04T21:47:14.587081419Z	2023-04-04T21:46:50Z	12.5252525252526	usage_user	cpu	cpu2	server-a
		3	2023-04-04T21:46:14.587081419Z	2023-04-04T21:47:14.587081419Z	2023-04-04T21:47:00Z	13.2788559754852	usage_user	cpu	cpu2	server-a
		4	2023-04-04T21:46:14.587081419Z	2023-04-04T21:47:14.587081419Z	2023-04-04T21:46:20Z	13.0303030303028	usage_user	cpu	cpu3	server-a
		4	2023-04-04T21:46:14.587081419Z	2023-04-04T21:47:14.587081419Z	2023-04-04T21:46:30Z	12.8048780487806	usage_user	cpu	cpu3	server-a
		4	2023-04-04T21:46:14.587081419Z	2023-04-04T21:47:14.587081419Z	2023-04-04T21:46:40Z	13.0479102956167	usage_user	cpu	cpu3	server-a
		4	2023-04-04T21:46:14.587081419Z	2023-04-04T21:47:14.587081419Z	2023-04-04T21:46:50Z	13.0391173520563	usage_user	cpu	cpu3	server-a
		4	2023-04-04T21:46:14.587081419Z	2023-04-04T21:47:14.587081419Z	2023-04-04T21:47:00Z	12.7272727272727	usage_user	cpu	cpu3	server-a
1 Like

Paul,

You mentioned that you are using the “CPU plugin”. Can you provide a link to this specific plugin?

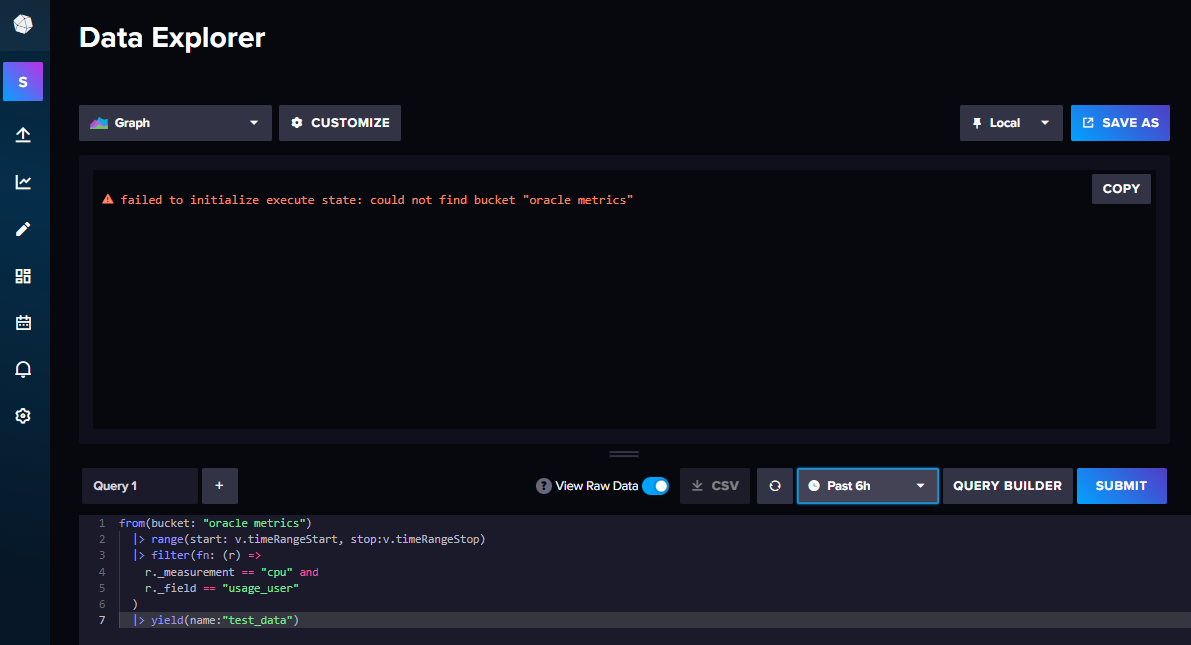
From your query and the output data you shared, I see the following structure for your Influx database:

field name: usage_user
field values: 12.670025188917, 12.7401415571282, etc.

measurement name: cpu

tag “cpu” values: cpu-total, cpu0, cpu1, cpu2, cpu3
tag “host” values: server-a

Your flux query will always begin with these 2 lines:

from(bucket: "oracle metrics")
  |> range(start: v.timeRangeStart, stop:v.timeRangeStop)

and then follow with a series of Flux filter functions to get the data you want:

  |> filter(fn: (r) => r["_measurement"] == "cpu")
  |> filter(fn: (r) => r["_field"] == "usage_user")
  |> filter(fn: (r) => r["cpu"] == "cpu-total" or r["cpu"] == "cpu0" or r["cpu"] == "cpu1" or r["cpu"] == "cpu2" or r["cpu"] == "cpu3")
  |> filter(fn: (r) => r["host"] == "server-a")

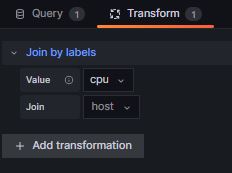
and then (optionally) an aggregateWindow function, and a group function to get all of the result tables into one (see the first column of your data…it has 0, 1, 2, 3, 4. If you use a group function, it should put them all to a single result table. The yield is just to deliver the data and is not always needed.

  |> aggregateWindow(every: v.windowPeriod, fn: last, createEmpty: false)
  |> group()
  |> yield(name: "your-data")

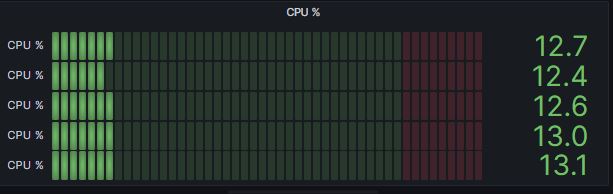
You have a couple of options to display your 4 CPUs (cpu0, cpu1, cpu2, and cpu3):

  1. Modify the filter function above to filter just the one you want for the given panel. Recreate the query with a different filter setting for a second, third, etc. graph.
  2. Create a variable in Grafana for the tag values (cpu0, cpu1, cpu2 and cpu3). Then they will be in a dropdown box in Grafana for you to select, and the graph(s) will change accordingly.
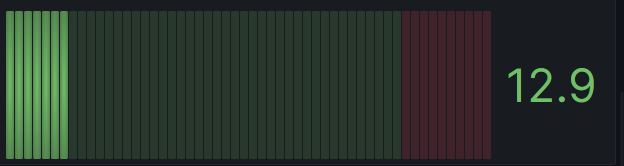
  3. A single graph like you originally shared, but with labels cleaned up. You can use the Organize Fields transformation and possibly some other techniques to get the graph labels correct.

Which of the above are you trying to do?

1 Like

Thanks Grant.

It was part of the core install of Telegraf and was installed by default.

As I only want 4 items in the graph, this works for me;

  from(bucket: "oracle metrics")
  |> range(start: v.timeRangeStart, stop:v.timeRangeStop)
  |> filter(fn: (r) => r["_measurement"] == "cpu") 
  |> filter(fn: (r) => r["_field"] == "usage_user")
  |> filter(fn: (r) => r["cpu"] == "cpu0" or r["cpu"] == "cpu1" or r["cpu"] == "cpu2" or r["cpu"] == "cpu3")
  |> filter(fn: (r) => r["host"] == "server-a")
  |> yield(name: "your-data")

works

However adding the aggregateWindow function, and a group function only displays 1 value, instead of 4

doesnt

I would like to use the top graph in this post with the labels tidied up.

Is there any benefit to adding the aggregateWindow function, and a group function?

I might have got there…
I used Transform to join by labels

trans

Which resulted in;

cpu

Which is exactly what I wanted!
@grant2 - Thanks for showing how to limit the cpu entries |> filter(fn: (r) => r["cpu"] == "cpu0" or r["cpu"] == "cpu1"... and also the mention of using Transformation to sort out the labels.

The Grafana documentation is extensive, but as a new user I’m find a lot of the basic features/structures are overlooked in the documentation, or well hidden, and make new users look like… erm… ‘new users’ :joy:

Awesome, looks like you got it to display the way you want.

You are actually conquering both InfluxDB (with Flux) and Grafana, but of which have grown in capabilities and complexity in recent years.

If you move on to alerts in Grafana using Flux queries, I wrote a tutorial about 6 months ago that you can find here.

1 Like