I have multiple storage arrays that I am capturing statistics from and injecting the data into the InfluxDB as Time Series data. I have written a query that is able to display the data for a single array on a pie chart, but I would really like to be able to aggregate the data from all of the storage arrays that meet certain criteria into a single pie chart.
An example of the queries for a single array:
SELECT mean(“volumes”) + mean(“snapshots”) + mean(“sharedspace”) + mean(“system”) AS “used capacity” FROM “purity.array.stats” WHERE (“host” = ‘Array01’) AND $timeFilter GROUP BY time($__interval) fill(null)
and
SELECT mean(“capacity”) - (mean(“volumes”) + mean(“snapshots”) + mean(“sharedspace”) + mean(“system”)) AS “available capacity” FROM “purity.array.stats” WHERE (“host” = ‘Array01’) AND $timeFilter GROUP BY time($__interval) fill(null)
with the output of
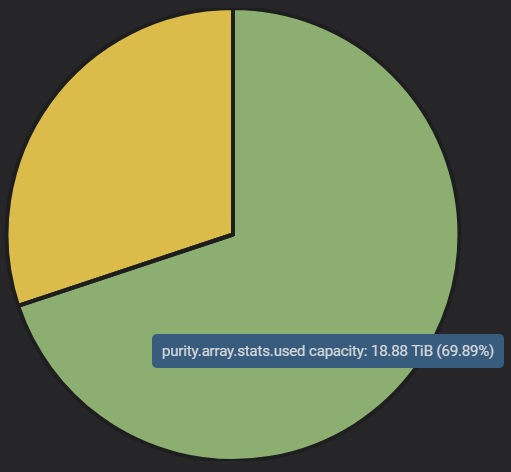
I would like to be able to aggregate the “used capacity” and “available capacity” from multiple arrays into a single pie chart, but if I use regex in place of the ‘Array01’ name, then the query fails and I no longer have a pie chart. Is this possible?
Thanks in advance…