Is it possible to display a secondary y-axis in a time series that has limited height? ie it only occupies the bottom 20% of the panel.
This functionality is default in a candlestick graph, where the volume bars only take up the bottom of the graph:

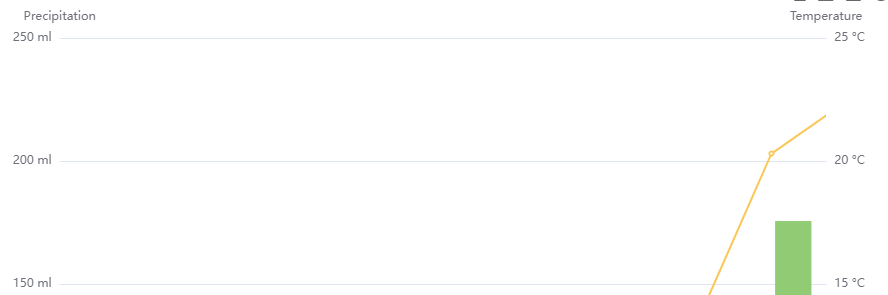
However there seems to be no way to do this in a timeseries. I could approximate this behavior by setting a max on the second y-axis, but this wouldn’t really work as it would need to be manually adjusted as the data changes.