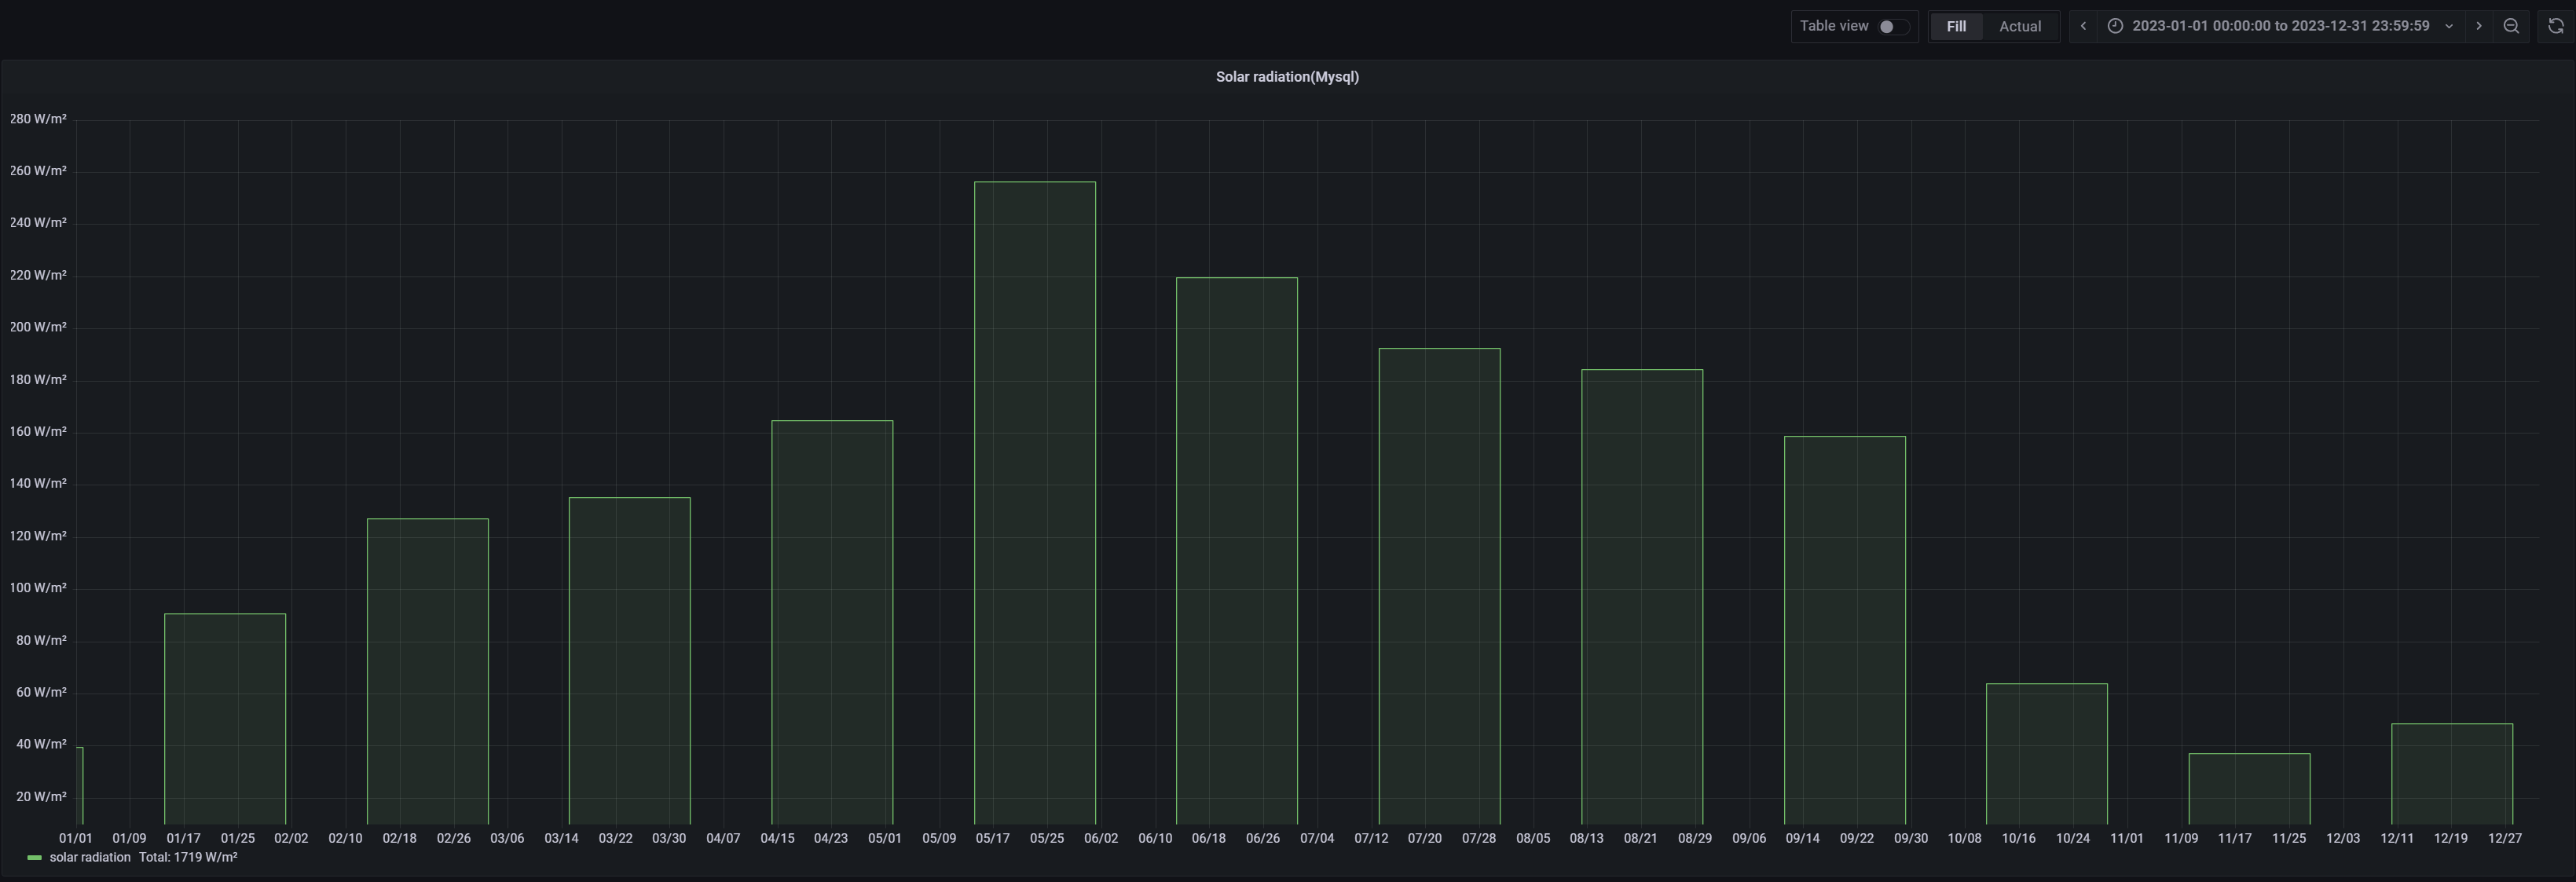
One of the values I do store in the context of my PV system is the solar radiation (kW/m²), one value every minute. So far I get nice graphs and can drilldown in any timeframe I want.
What I’d like to achieve now is a colum chart with a sum per month.
I tried to group the data by 4weeks, but this gives me approx 3 times of the monthly (at the end annual) total
This is the query
SELECT mean(“value”) FROM “modbus.2.holdingRegisters.5_Solarstrahlung” WHERE time >= 1674917300729ms and time <= now() GROUP BY time(4w) fill(null)
I copied it from the inspector as I never did work with queries, I used the UI only so far.
I am afraid that as of this time, InfluxQL does not aggregate by month. You would have to switch to Flux or SQL. More details in the very last table from this blog post.
Hello @grant2 , I used a CSV dump (which is still running in the background) and loaded the data into MySQL. Here I have one dataset per minute.
However…still don’t get the result I expect to see.
I am pretty sure it is me, being the problem by not knowing how to aggregate…not the system.
Any help appreciated
SELECT
  $__timeGroupAlias(Datetime,30d),
  avg(Ana5_Solarstr) AS "solar radiation"
FROM Winsol_2023
WHERE
  $__timeFilter(Datetime)
GROUP BY 1
ORDER BY $__timeGroup(Datetime,30d)