following situation:
I have some solar panels and using some esp32 stuff, I got a value every 30 minutes which represents the average of the generated power during the last 30 minutes time period.
Hopefully you understand what I mean.
So for example in a time range from 8-10 o’clock, I get 4 values, e.g.:
8:30: 150W
9:00: 230W
9:30: 170W
10:00: 50W
These are the values, which are permanently written into my InfluxDB and with which I have to deal with.
So that means, if I sum up these values (600W) and divide them through the time, I should get 300Wh.
My goal sounds pretty easy. I want to display just the value of all Wh which my solar panels have collected. So I have to do some calculation in a grafana query, I think. Or not?
The result do not have to show a specific time period (it could, but it do not need to). I am interested in the sum of every generated Wh during the whole year.
Can anyone help me?
I am not able to do this SQL query by myself.
You should be able to accomplish this in Grafana, but some more details would help us.
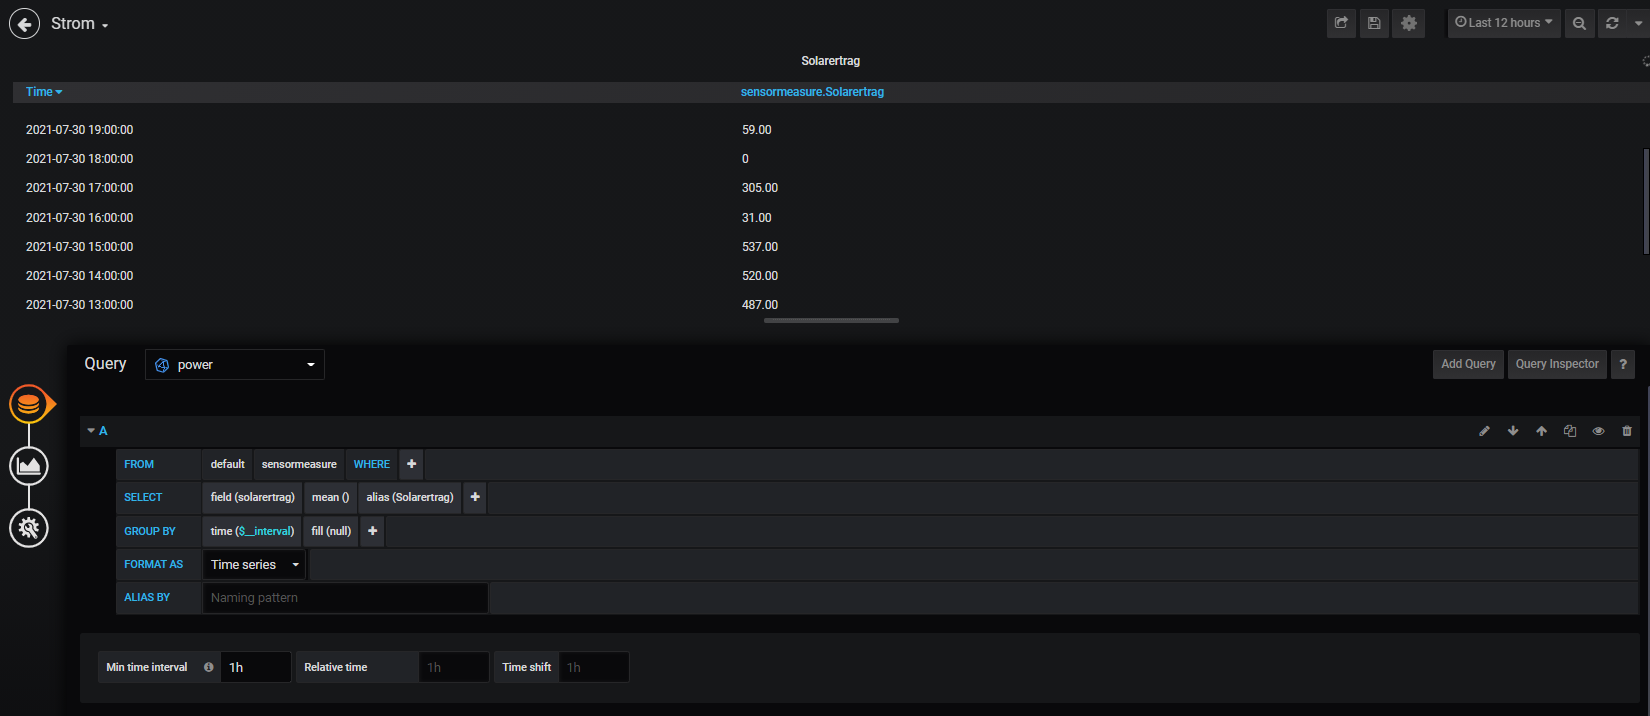
Is your InfluxDB datasource configured and connected to your Grafana instance? Can you make any queries on this data? If so, can you share what that data looks like using the inspect feature in the panel or by taking a screenshot of the query result using the table panel?
can you explain this a bit? What is this graph representing, and what do you want it to represent instead? Can you show me what that query returns if you use the table panel instead?
ok, try to explain. my device shows me the average of produced power every ~1h. Not excactly once an hour. And because it’s not excactly one time in an hour, I have to calculate the Wh in grafana and not only make an addition of all values.
I have to sum up all values and divide them through the amount of hours since the first value.
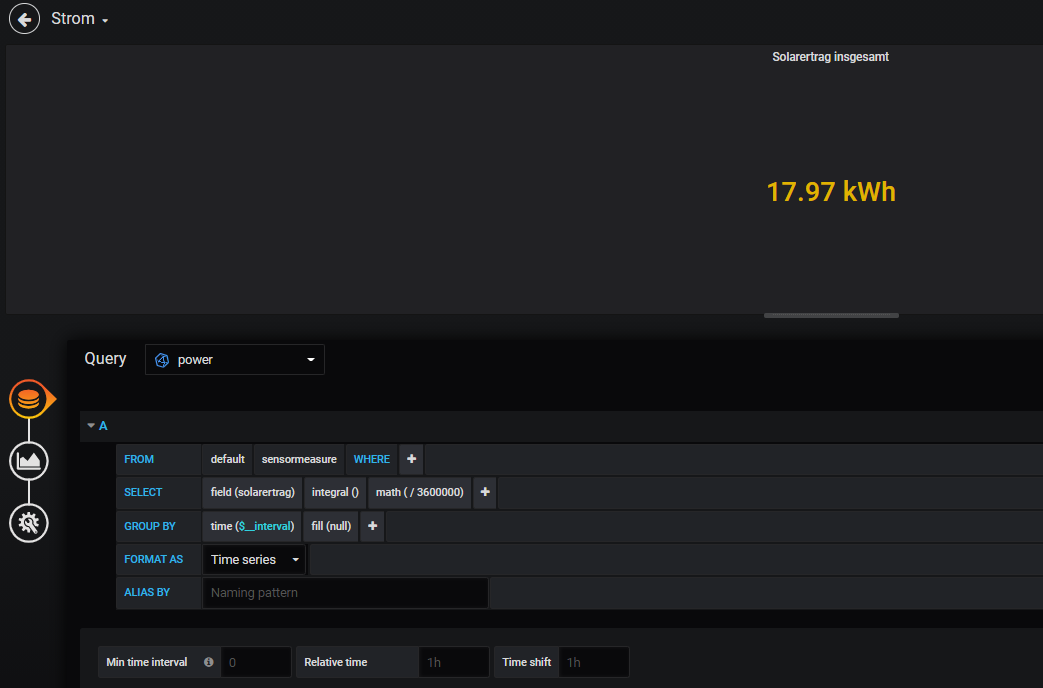
@sweetiegwendoline if you have irregular readings, maybe check this thread to see if the queries listed there help: Calculate Energy Consumsion manually. The Influx integrate() function could also be helpful for working with readings at irregular time periods.
By the way, could you also clarify what your desired output is? Is it a single value (total for period), or hourly/daily/etc? I wasn’t quite sure based on what you said.