Hello,
I’m trying to create a stacked bar chart from data stored in a mongo db via grafana cloud mongodb plugin
When I run the mongodb query in grafana cloud, the data in table format are shown as per following:
event1 product1 2
event2 product3 2
event1 product2 1
I would like visualize in a stacked bar chart the total number of products by event in each stacked bar
event1 product1 product2 3
event2 product 3 3
I set the panel to bar chart, enabled stacking and set the x axis to event however it does’t work apparently
Any help appreciated, thank you!
eventname,product,count
event1,product1,2
event2,product3,2
event1,product2,1
Could you please provide a cleaner sample data for the final result you want? It is not clear how event2 has product, 3, 3
event1 product1 product2 3
event2 product 3 3
Hi,
Thanks for answering, so basically in each event one or more products can be used, each product can have more than one instance
event A has 2 products and a total of 3 instances
event C has one product and a total of 3 instances
In a csv would be:
eventA product1 product2 3 (the total count of instances)
eventC product2 2 (the total count of instances)
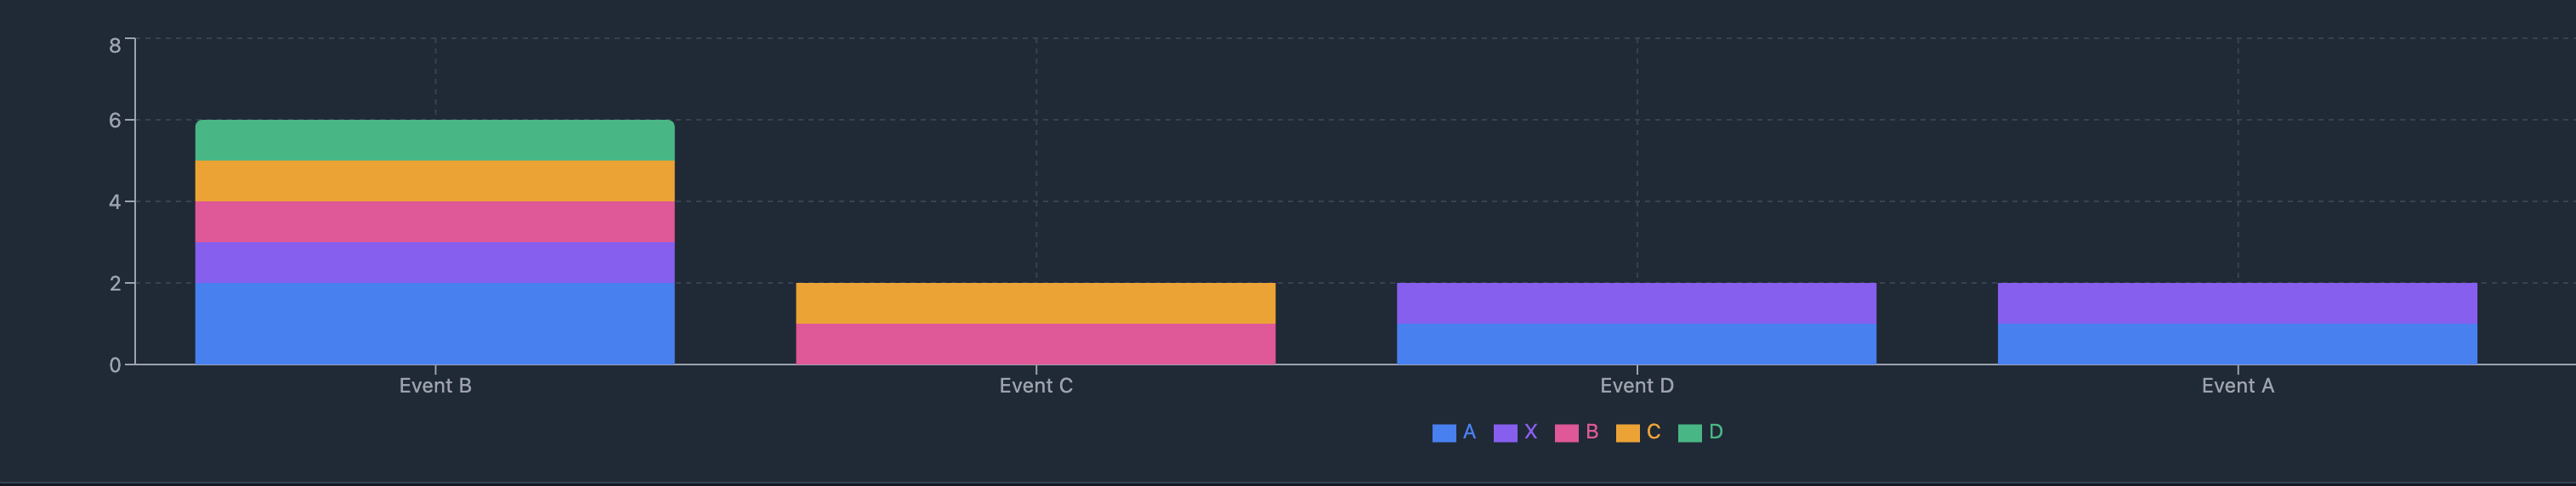
So I should end up with a stacked bar chart where each bar represent the event name, the total of the bar represent the total amount of instances among the products used in that event and inside each bar each color would represent a product
I’m enclosing an image for reference, for example in the image, column “Event B“ has a total of 6 instances and 5 products (5 colors)
Thank you!