Hi Everyone,
I created a custom Datepicker / Date-picker I would like to share with you.
It was a feature I was missing myself and made this kind of by coincidence, while I was testing out the ‘Dynamic Text’ plugin (Big thanks to the developers of this plugin).
I saw numerous people asking about something similar, so maybe this can help you on your way.
note: this not an official plugin in any way. Its just a creative workaround to select a timerange or date.
How it works (example 01) : range 1 month

The pop-up is just for this example to show you the input (this can be disabled)
Furthermore the 'Dynamic Text' plugin offers the option to use and specify what fields and data from you datasource you use. Additionally you can use custom JavaScript + the option to apply custom CSS styling. Furthermore you can use this in combination with '**onclick()**' events where the magic happens ;-)
With this date-picker you can quickly select a calendar day/custom time range and the dashboard will change and show data from that specific range.
Date/Timerange
Grafana is based on a ‘From’ and ‘To’ Time-range (So even if you want to change the date-picker only to ‘1’ specific day you will always need to specify a 2 ranges ‘from’ and ‘to’)
Date start 'From': 01-08-2023 start_time
Date end   'To'  : 01-08-2023 end_time

But with the correct styling a user will only see 1 ‘date’
Example 02 : Time-range 1 day

Extra info:
For this example I will show how to make a picker for a full month.
I use a table (with static values) from GoogleSheet that I use as my Datasource,
but this can also be achieved with other Datasources.
How to set this up, check out the link below.
Link: https://youtu.be/GnWZsHjM5To
(I can confirm this also works for ‘influxDb’ which im using myself but requires extra steps for extracting date etc…)
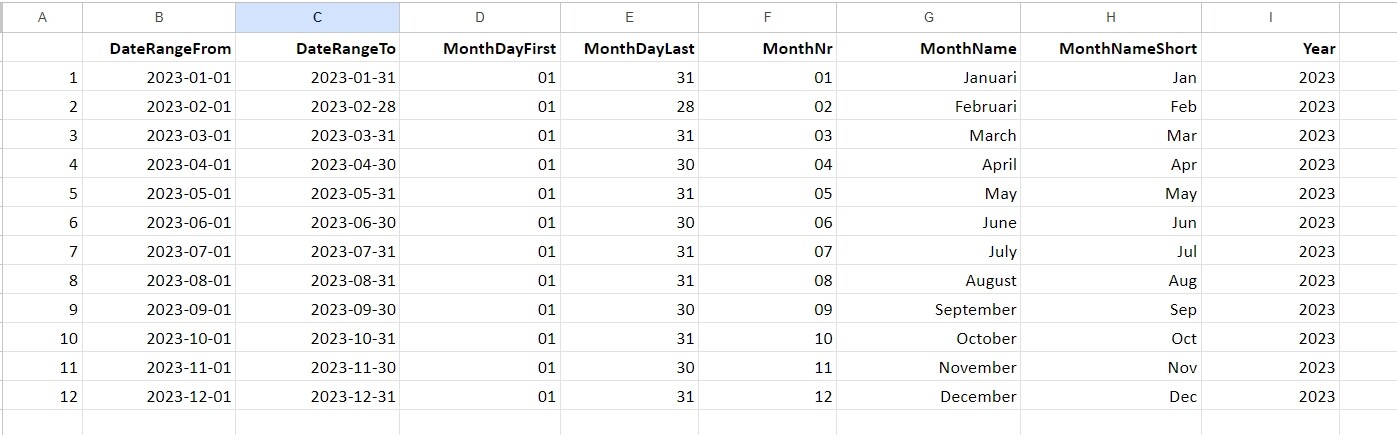
My example table:
For this you will need to :
-
Install the ‘Dynamic Text’ plugin
-
Set
GF_PANELS_DISABLE_SANITIZE_HTML to 'true'in the Grafana configuration (grafana.ini)- GF_PANELS_DISABLE_SANITIZE_HTML=trueOn how to disable Sanatizing read more here :
Content | Volkov Labs -
A query/table that contains one or two column(s) with a ‘start’ and ‘end’ DATE/RANGE (depending what you want to achieve)
The format used by Grafana for setting the range "from" and "to" is as
follow "2023-08-01T00:00:00" == "YYYY-MM-DD + T + HH:MM:SS"

Note: For the people from Europe the date Grafana is using is specified the
other way around! so YEAR comes first, then MONTH, then DAY ;-)
As for the the ‘start’ and ‘end’ TIME this will be explained later in this post.
ps. I did not take [T]imezone into consideration in this example. But changing the range will work even with out that.
Follow the steps from below to create buttons filled/linked with data from your datasource.
Step 1) Add a -new- visualization panel.
Step 2) Change/select ‘Dynamic Text’ plugin
Step 3) Scroll down until you see the section ‘DYNAMIC TEXT’
Step 3a) Change render template to ‘All rows’
Step 3b) Add ‘Styles’ & ‘Javascript Code’ to section
“Select Editors to display. Editors with updated values always displayed”
Step 4) Editor (Optional: change to your likings)
Im using setting ‘HTML’ and formatting to ‘Auto’
Step 5) In the ‘CONTENT’ section
Copy/paste the code from below.
{{#each data}}
{{/each}}
This is the base to show ALL rows from your table. This works like the .forEach() from JavaScript.
But only using this code will give you an ‘empty’ result. Because we haven’s specified what data to retrieve/grep yet.
If you want to use data from just a specific row read more on how to use this here :
Or watch Youtube video (min 3:05 to 3:55)

Step 5a) Specify what data you would like to grep/use
For this you need to specify one or more headers {{header field here}} from your datasource/table

To grep values from columns 'DateRangeFrom' and 'DateRangeTo' for each
row from the example table above use double curly braces '{{header field here}}'
So it would be '{{DateRangeFrom}}' and '{{DateRangeTo}}'
In ‘CONTENT’ section copy/paste one of the examples below
Example 01

{{#each data}}
<div>{{DateRangeFrom}}  to  {{DateRangeTo}}</div>
{{/each}}

Example 02

{{#each data}}
<div>{{Monthname}}	</div>
{{/each}}
Expected result here

Example 01  				  Or 	Example 02

2023-01-01 to 2023-01-31			Januari
2023-02-01 to 2023-02-28			Februari
2023-03-01 to 2023-03-31			March
2023-04-01 to 2023-04-30			April
2023-05-01 to 2023-05-31			May
2023-06-01 to 2023-06-30			June
2023-07-01 to 2023-07-31			July
2023-08-01 to 2023-08-31			August
2023-09-01 to 2023-09-30			September
2023-10-01 to 2023-10-31			October
2023-11-01 to 2023-11-30			November
2023-12-01 to 2023-12-31			December
*note: for now this is still plain text, cause we haven’t added any styling or event triggers
Step 5b) Like a website you can also add CSS styling by adding/specifying a class to an element. Scroll down to the section ‘CSS Styles’ to do so
You can use the following CSS/code as an example

 .button {
 padding: 4px 10px;
 text-align: center;
 text-decoration: none;
 display: inline-block;
 font-size: 15px;
 letter-spacing: 0.5px;
 margin: 4px 2px;
 transition-duration: 0.6s;
 cursor: pointer;
 border-radius: 10px;
 background-color: #fcfcfc;
 color: black;
 border: 2px solid lightgrey;
 }
And change the ‘CONTENT’ to code
<p>
{{#each data}}
<div class="button" type="button")">from '{{DateRangeFrom}}' to '{{DateRangeTo}}'</div>
{{/each}}
the result will be:

Step 6) Add ‘onclick’ event and change the Dashboard timerange ‘FROM’ and ‘TO’
For this I use 3 things.
- An ‘onclick’ event to
<div>element
(In simple terms > When you click on the button → trigger this event and execute JavaScript code) - The JavaScript code that changes the timerange of the Dashboard after selecting/pressing the button
- Set the ‘start’ and ‘end’ TIME of the select range (You do this in the Javascript part)
Step 6.1) Go to section ‘CONTENT’ again add the ‘onclick()’ part to your code.
<p>
{{#each data}}
<div class="button" type="button" onclick="changeToSelectedRange('{{DateRangeFrom}}','{{DateRangeTo}}')">from '{{DateRangeFrom}}' to '{{DateRangeTo}}'</div>
{{/each}}
Step 6.2) Go to ‘Javascript Code’ and copy/paste code from below
  changeToSelectedRange = (range_start, range_end) => {

  let timeStart = "T00:00:00"; //<<-- Change 'start' time here of the range
  let timeEnd = "T23:59:59";   //<<-- Change 'end' time of the range
  let rangeStart_merged = range_start + timeStart;
  let rangeEnd_merged = range_end + timeEnd;

  //<<-- get an alert pop-up (for testing output)
  //alert("\n" + "Range start : " + rangeStart_merged + "\n\n" + "Range end : " + rangeEnd_merged);

  //Two lines below are responsible to change the actual timerange changeof the dashboard
  timeSrv = angular.element('grafana-app').injector().get('timeSrv');
  timeSrv.setTime({ from: rangeStart_merged, to: rangeEnd_merged });

  return;
}
Step 6.3) Set ‘start’ and ‘end’ TIME in the JavaScript code you just copy/pasted
  let timeStart = "T00:00:00";
  let timeEnd = "T23:59:59";

  Change the time in the lines above if you prefer different selection
  of start en end time.
Step 7) The use of extra data to show (optional)
For the most basic ‘Datepicker’ you will only need two columns '{{DateRangeFrom}}' '{{DateRangeTo}}'
As you might notice in my example table I used some extra columns.

This data can be used as additional {{variable}} text to add to your buttons.
As mentioned at step ‘5a’ you will grep/iterate data for each row.
Depending on what other {{column headers}} you specify, this can be used/shown inside
the button we just created earlier.
To create buttons like the example below use the following code :

Copy/paste this in ‘CONTENT’
{{#each data}}
<div class="button" type="button" onclick="changeToSelectedRange('{{DateRangeFrom}}','{{DateRangeTo}}')">
  <b>{{MonthName}} {{Year}}</b><br>(01 - {{MonthDayLast}} {{MonthNameShort}})
</div>
{{/each}}
For the rest you can you use any regular text as well as < HTML > code in the CONTENT section to style your button/view as you please
If everything is correct you should have your own custom styled Datepicker now!
Hope this helps.
Cheers

