-
What Grafana version and what operating system are you using?
Grafana Latest (11.3.0) & Loki v2.9.0 -
What are you trying to achieve?
I want to get a “pie chart” that shows the different browsers people have used to access my Apache web server. The information should be collected from the logs. The logs look like this:
::1 - - [28/Oct/2024:19:26:15 +0100] "GET / HTTP/1.1" 304 - "-" "Mozilla/5.0 (Windows NT 10.0; Win64; x64) AppleWebKit/537.36 (KHTML, like Gecko) Chrome/130.0.0.0 Safari/537.36" -
How are you trying to achieve it?
With the following query, I’m sending the browsers by JSON to labels with the browsers label:
{job="apache-logs"}
| pattern `<ip> - - \[<timestamp>\] "<method> <path> <protocol>" <status> <size> "-" "<user_agent>"`
| regexp "(?P<browser>(Firefox|Chrome|Safari|Edge|Opera))"
| label_format browser="{{.browser}}"
after that, I use transformations:
- Extract fields to extract the
browserlabel from labels. - Filter by data value to ignore null or empty browsers.
- Organize fields by name to hide all columns except the
browsercolumn.
This leaves me with a single column named “Browsers,” containing as many rows as there are values, with each row showing a browser name (e.g., 4 rows with “Firefox,” 10 rows with “Chrome,” etc.).
- What did you expect to happen?
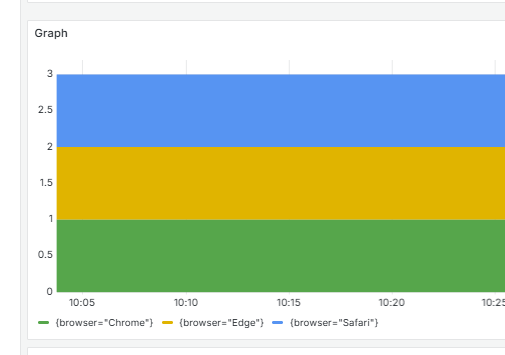
When I put it in a pie chart, it only shows “browser” and doesn’t display the different browsers. - Can you copy/paste the configuration(s) that you are having problems with?
{
  "id": 12,
  "type": "table",
  "title": "Browsers",
  "gridPos": {
    "x": 0,
    "y": 0,
    "h": 8,
    "w": 12
  },
  "fieldConfig": {
    "defaults": {
      "custom": {
        "align": "auto",
        "cellOptions": {
          "type": "auto"
        },
        "inspect": false
      },
      "mappings": [],
      "thresholds": {
        "mode": "absolute",
        "steps": [
          {
            "value": null,
            "color": "green"
          },
          {
            "value": 80,
            "color": "red"
          }
        ]
      },
      "color": {
        "mode": "thresholds"
      }
    },
    "overrides": []
  },
  "transformations": [
    {
      "id": "extractFields",
      "options": {
        "source": "labels",
        "format": "json",
        "replace": true,
        "keepTime": false
      }
    },
    {
      "id": "filterByValue",
      "options": {
        "filters": [
          {
            "fieldName": "browser",
            "config": {
              "id": "equal",
              "options": {
                "value": ""
              }
            }
          },
          {
            "fieldName": "browser",
            "config": {
              "id": "isNull",
              "options": {}
            }
          }
        ],
        "type": "exclude",
        "match": "any"
      }
    },
    {
      "id": "organize",
      "options": {
        "excludeByName": {
          "filename": true,
          "ip": true,
          "job": true
        },
        "indexByName": {},
        "renameByName": {
          "browser": ""
        },
        "includeByName": {}
      }
    },
    {
      "id": "reduce",
      "options": {
        "reducers": [],
        "mode": "seriesToRows",
        "includeTimeField": false,
        "labelsToFields": false
      }
    }
  ],
  "pluginVersion": "11.3.0",
  "targets": [
    {
      "refId": "A",
      "editorMode": "code",
      "expr": "{job=\"apache-logs\"} \r\n| pattern `<ip> - - \\[<timestamp>\\] \"<method> <path> <protocol>\" <status> <size> \"-\" \"<user_agent>\"`\r\n| regexp \"(?P<browser>(Firefox|Chrome|Safari|Edge|Opera))\"\r\n| label_format browser=\"{{.browser}}\"\r\n",
      "queryType": "range"
    }
  ],
  "datasource": {
    "uid": "fe1uj54ymy5tsc",
    "type": "loki"
  },
  "options": {
    "showHeader": true,
    "cellHeight": "sm",
    "footer": {
      "show": false,
      "reducer": [
        "sum"
      ],
      "countRows": false,
      "fields": ""
    }
  }
}
- Did you receive any errors in the Grafana UI or in related logs? If so, please tell us exactly what they were.
No errors - Did you follow any online instructions? If so, what is the URL?
No
