I am monitoring the size of all logfiles I’m sending to loki using a very simple shell script and Textfile collector along the lines suggested by Monitoring directory sizes with the Textfile Collector – Robust Perception | Prometheus Monitoring Experts
so now I can pretty quickly identify surprising log growth with a panel like this:
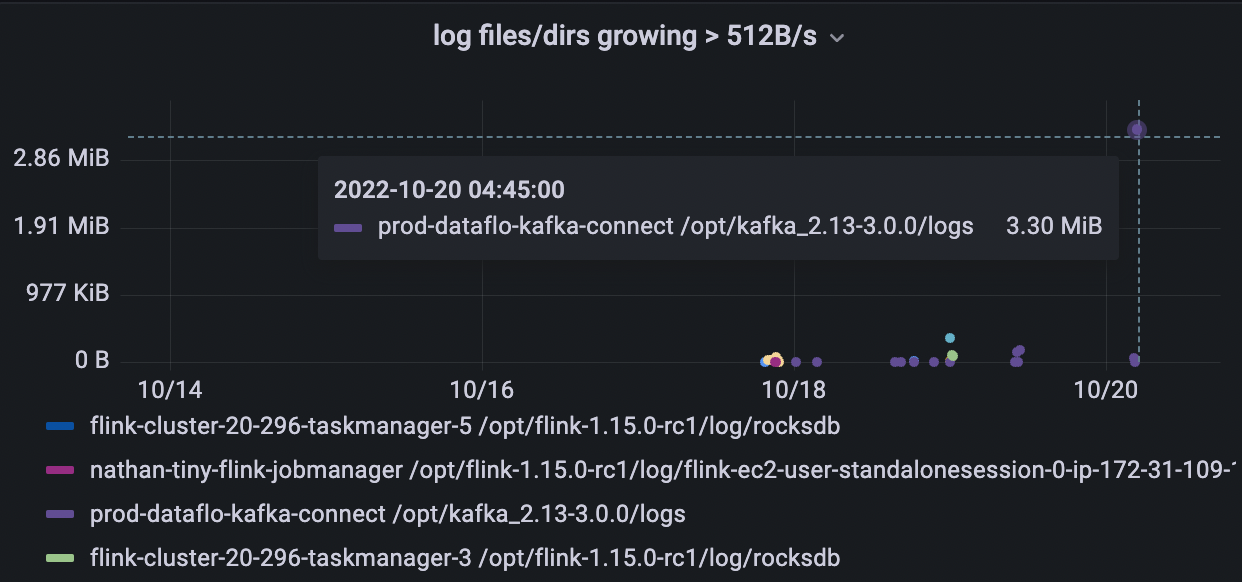
next I would like to be able to find examples of the log lines responsible for this growth.
I fear this is something I can’t really express in LogQL – “give me the most common log line in this stream – allowing for minor variations, e.g. some integer/hex changing.”
to make this concrete, here’s what’s responsible for the spike above:
[2022-10-20 04:05:56,636] INFO [source_20_34_shard_002|task-0] Streaming requested from LSN LSN{3B25/C54273D0}, received LSN LSN{3B25/C5463900} identified as already processed (io.debezium.connector.postgresql.connection.AbstractMessageDecoder:45)
[2022-10-20 04:05:56,636] INFO [source_20_34_shard_002|task-0] Streaming requested from LSN LSN{3B25/C54273D0}, received LSN LSN{3B25/C5463A40} identified as already processed (io.debezium.connector.postgresql.connection.AbstractMessageDecoder:45)
[2022-10-20 04:05:56,636] INFO [source_20_34_shard_002|task-0] Streaming requested from LSN LSN{3B25/C54273D0}, received LSN LSN{3B25/C5463AF0} identified as already processed (io.debezium.connector.postgresql.connection.AbstractMessageDecoder:45)
I can think of ways to do this programmatically outside of loki/grafana, like simple sampling of log lines, light parsing to recognize lines identical but for one or two fields. but I can’t see how that fits into the loki framework…
thanks in advance for your ideas!