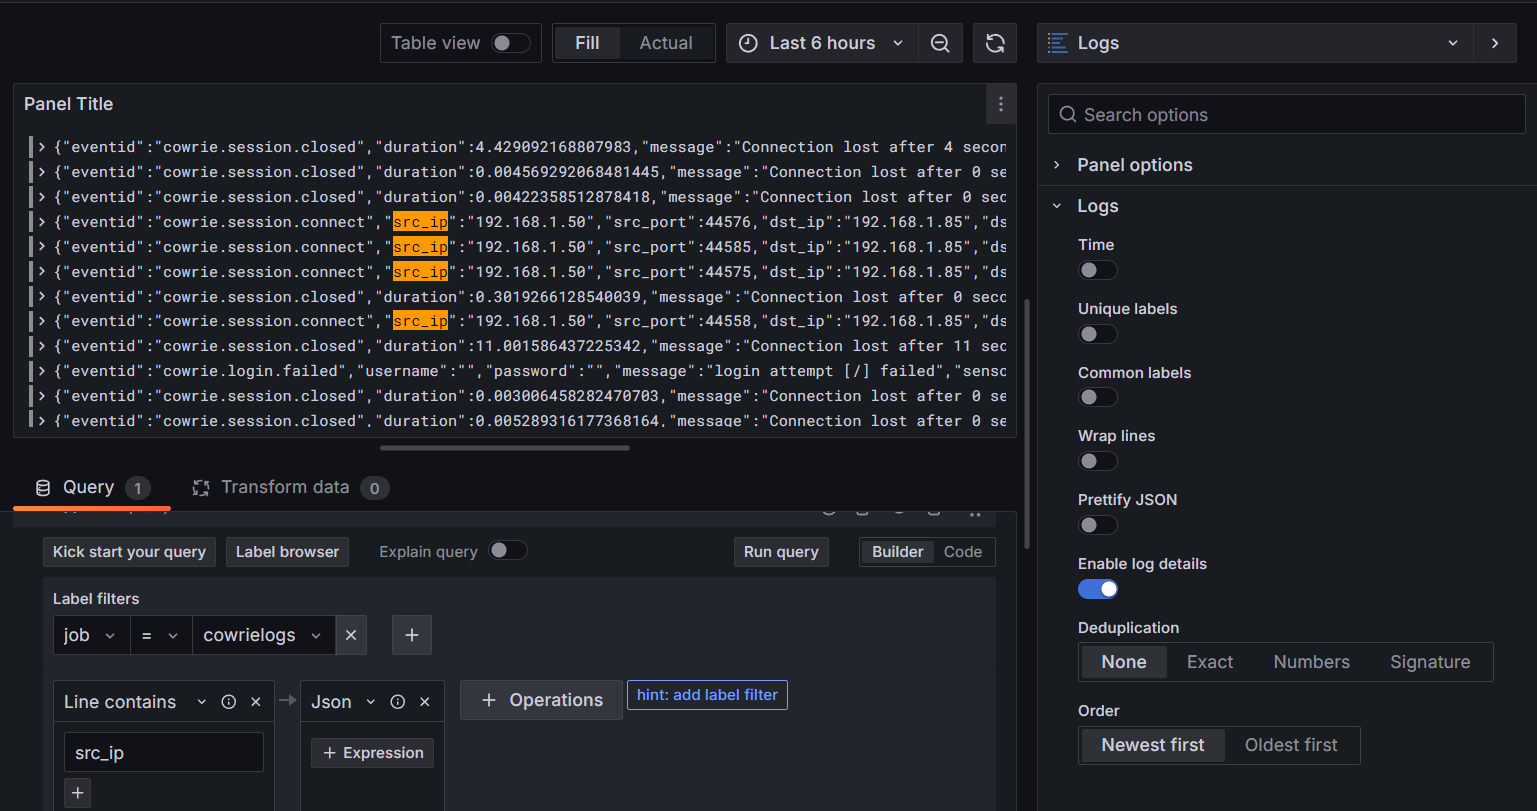
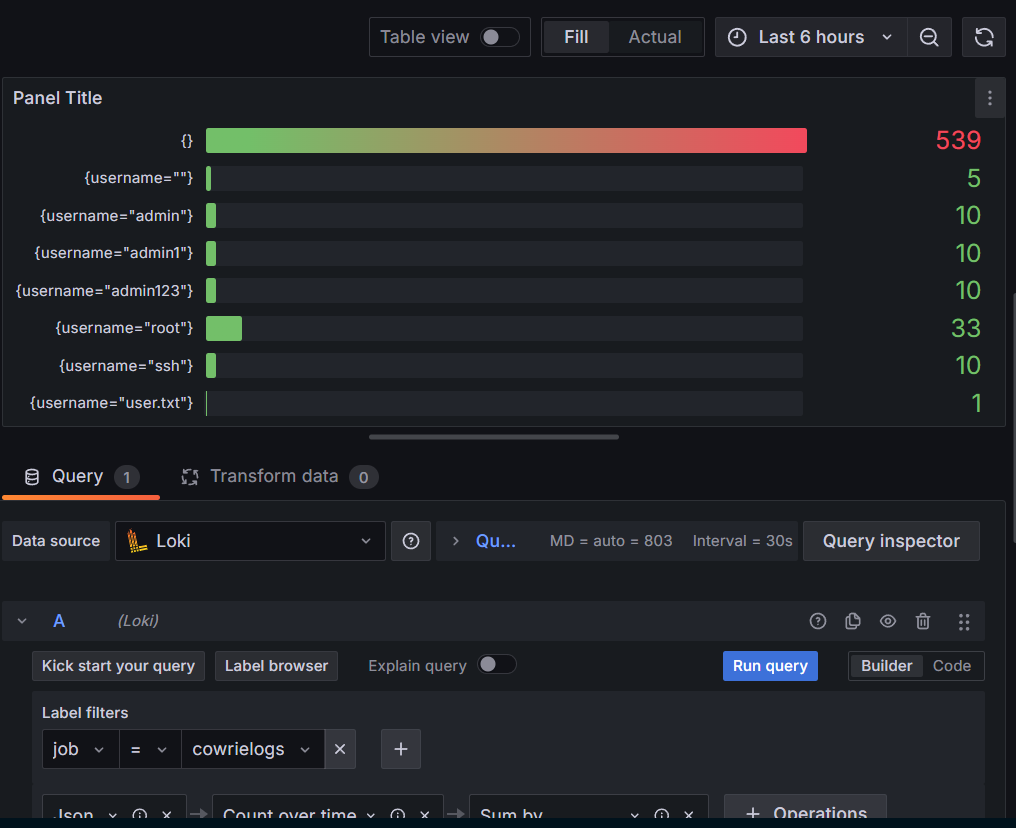
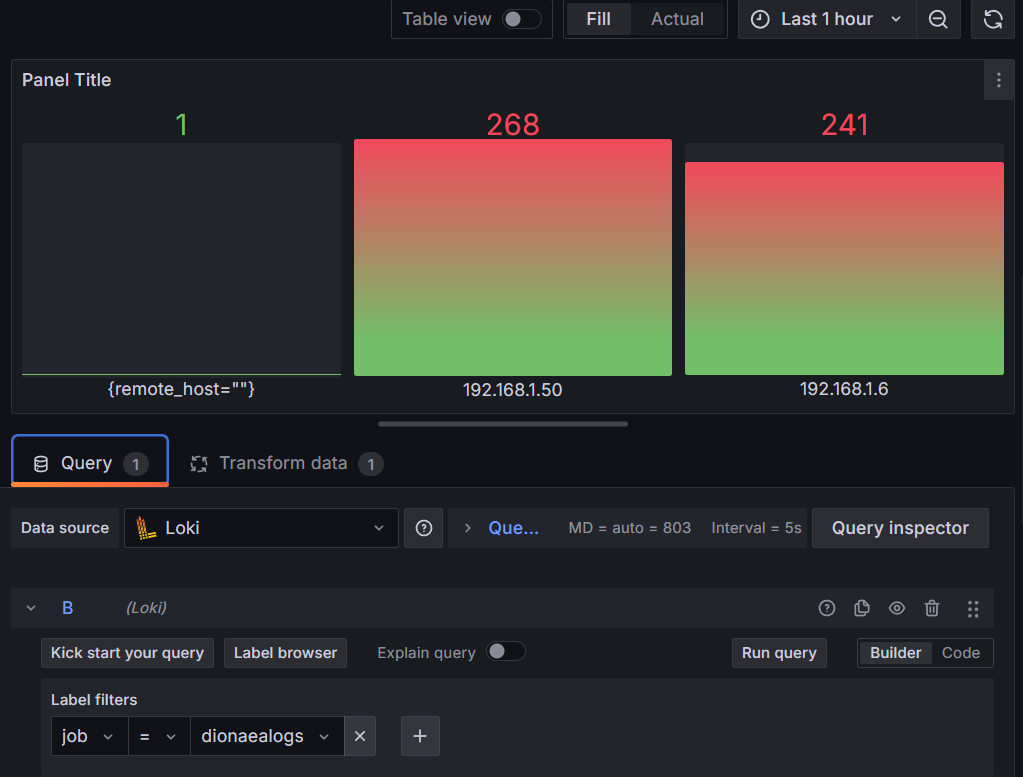
Hello all Grafana community members, I am a beginner in Grafana Loki. How do I visualize the data field that I want here, for example “src_ip” into a horizontal bar (like the example of the second picture) ?. I can only find Grafana visualization only in the form of tables and Logs.
Note: my log data is in “json” format which comes from the local machine sent to the Loki agent. Thank you for reading my message.
Maybe something like sum by (ip) (count_over_time({SELECTOR} [$__auto])). See Metric queries | Grafana Loki documentation for metrics query example.
@tonyswumac
Thank you for taking the time to reply to my message. Through your advice, I was finally able to get the results I wanted. However, I want to remove the data such as “{}” (First image) and “remote_host=”" (Second image), how can I do that? I have used the functions of " != “{}” " (for the first image) and " != “” " (for the second image) but the result I get is no data. My second question is how to make the data displayed is the value without the label, for example in the first image I want the data displayed “admin”, “admin1” and so on without {username=}. Also for the second image, I only want to display the IP address without {remote_host=) Sorry if it’s troublesome, can you help me again?
@grant2
Thank you for taking the time and referring the post to me. The solution in the post you referred to worked well for my second question. Now I need a solution to the problem of how to hide data like “{}” (First image) and “remote_host=”" (Second image). I’ve been looking for that solution and still haven’t found it so far. Any help would be greatly appreciated.
One of these should work:
-
If you already know the label should exist you can add a simple check such as username=~".+".
-
You can check for error after a query to make sure you don’t aggregate on results with errors, like so:
{SELECTOR}
  | some query
  | some more query
  | __ERROR__ = ""