Hi, looking for some assistance please.
I am using Grafana, InfluxDB behind Nginx as a reverse proxy.
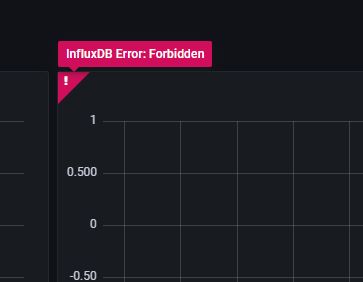
Generally everything works fine - except for every now and then randomly, all the graphs display “InfluxDB Error: Forbidden”
I cannot see anything that stands out in the Grafana, InfluxDB or Nginx logs.
When the error is clicked on - the following error is displayed :
403 Forbidden
403 Forbidden
nginx
Object
message:“InfluxDB Error: Forbidden”
data:Object
message:" 403 Forbidden
403 Forbidden
nginx "
error:“Forbidden”
response:" 403 Forbidden
403 Forbidden
nginx "
config:Object
method:“GET”
url:“api/datasources/proxy/1/query”
params:Object
data:null
precision:“ms”
inspect:Object
paramSerializer:serializeParams(e){…}
headers:Object
retry:0
hideFromInspector:false
If anyone has experienced this same error - please kindly advise where I can find out what is causing this?
Kind regards,
Liam
maybe too many requests to Influx are getting you rate limited?
Hi,
Thanks for the response.
I managed to work out what it was - I was using round robin DNS to balance and make the site available across two physical sites.
One site had a slightly different ModSec profile, so when requests went via that particular WAF, the 403 errors occurred.
Configs mirrored, and now the solution is fully functional.
Kind regards,
Liam
1 Like
Nginx 403 Forbidden error is a status code generated and displayed to the user when a client tries to access a part of the webserver with insufficient permissions. When nginx access a directory, it tries to index it and return the list of files inside it to the browser/client, however by default directory indexing is disabled, and so it returns the error Nginx 403 forbidden.
Incorrect Index File
The try_files tries the literal path you specify in relation to the defined root directive and sets the internal file pointer. If you have directory indexing off, and is having this problem, it’s probably because the try_files you are using has a directory option:
location / {
  try_files $uri $uri/ /index.html index.php;
}
to
location / {
  try_files $uri /index.html index.php;
}
Incorrectly set permissions
This error can also result from files and directories having incorrectly set permissions. In order to resolve this , change the directories permission to 755 and the file permissions to 644 . Make sure that the user running the Nginx process owns the files. For example, set user to www-data:
sudo chown -R www-data:www-data *
Finally, set the directory and file permissions as:
sudo chmod 755 {dir}
sudo chmod 644 {files}