Problem statement: Dynamic Highlighting of Metrics in Grafana Based on Conditions
You are tasked with creating a Grafana visualization for monitoring metrics stored in a PostgreSQL database. The metrics represent various data points, each with a name (metric_name) and a corresponding value (metric_value). The goal is to dynamically highlight rows in the table visualization based on specific conditions derived from the dataset.
Step 1: Create table in postgresql and then insert data in it.


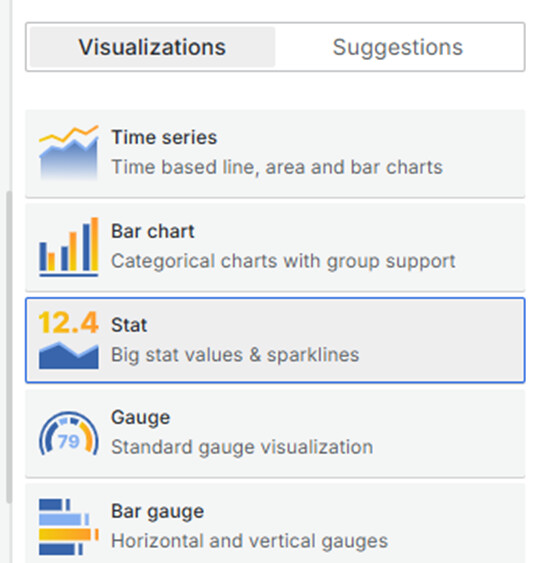
Step 2: Now select stat visualizations to display data on grafana panel and then configure the stat visualizations .

Step 3 : Fetch data using these query mention below.
–Query
WITH metrics_with_stats AS (
SELECT
metric_name,
metric_value,
AVG(metric_value) OVER () AS avg_value
FROM metrics_table
)
SELECT
metric_name,
metric_value,
CASE
WHEN metric_value = 0 THEN ‘Red’ – Highlight 0 as Red
WHEN metric_value >= avg_value * 1.3 THEN ‘Yellow’ – 30% above the average
WHEN metric_value <= avg_value * 0.7 THEN ‘Pink’ – 30% below the average
ELSE ‘Green’ – Default color
END AS background_color
FROM metrics_with_stats;

Step 4: Now Add transformation
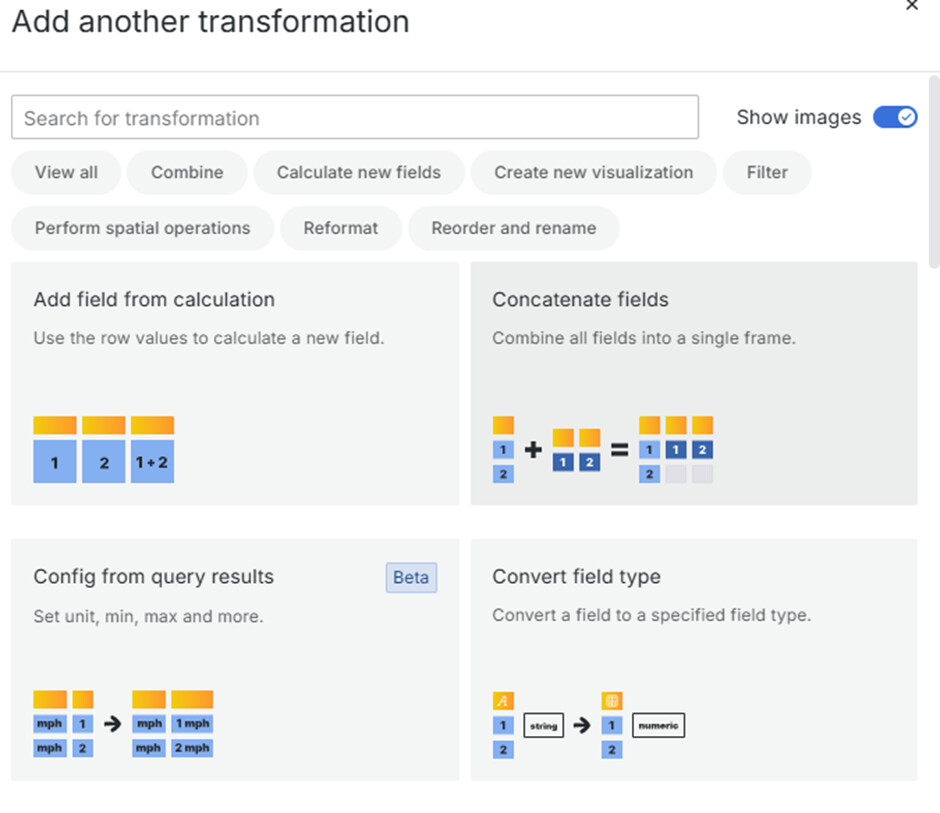
• Config from query results. Configur the transformation setting and select the fields mention below.
Final output:
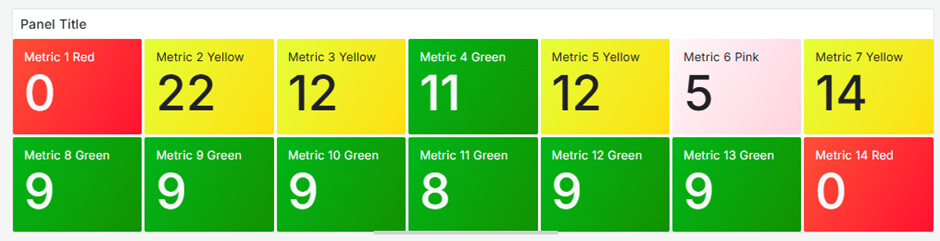
Highlight Zeros : Any row where metric_value = 0 must be highlighted with a red background.
Highlight High Values : Rows where metric_value is 30% or more above the average of all values should be highlighted with a yellow background.